StockFetcher Forums · General Discussion · John Carter - Squeeze<< 1 2 3 >>Post Follow-up
omarsitto
4 posts
msg #108809
Ignore omarsitto
11/14/2012 8:59:31 PM

Is anyone familiar with John Carter's TTM Squeeze based on the BB? I have it on the TOS system but I want to include it in my filter at StcokFetcher.. Any help is greatly appreciated !! Thanks..

novacane32000
331 posts
msg #108818
Ignore novacane32000
11/15/2012 9:52:16 AM

I am not the author but I believe this is what you are looking for

Fetcher[
/* Keltner Bollinger Squeeze Filter */

set{xUp, days(upper bollinger(20,2.0) above the Upper Keltner Band(20) , 100 )}
set{xDn, days(lower bollinger(20,2.0) below the Lower Keltner Band(20) , 100 )}

set{xUBB, days(high >= upper bollinger(20,2.0) , 100 )}
set{xLBB, days(low <= lower bollinger(20,2.0) , 100 )}

set{xRange, high - low }
set{xRPCT, xRange / atr(20) }

set{xMomStudy, cema(momentum(12), 10) }
set{xReturn1, xMomStudy + MACD Fast Line(12,26) }
set{xReturn, xReturn1 / 2 }

/* plots */

draw xUp
draw xDn on plot xUp

draw xRange
draw atr(20) on plot xRange

draw momentum(12)
draw macd(12,26,9)
draw xReturn


/* column displays */

add column xUp
add column xDn

add column xUBB
add column xLBB

add column xRange
add column atr(20)
add column xRPCT
add column xReturn

/* squeeze selection */

upper bollinger(20,2.0) below the Upper Keltner Band(20)

lower bollinger(20,2.0) above the Lower Keltner Band(20)

/* price, volume selection */

close above 1
volume above 300000
]


dwiggains
441 posts
msg #108820
Ignore dwiggains
11/15/2012 10:00:38 AM

Hi
This will get you started.

Fetcher[
draw Bollinger band (20)
set {A, upper bollinger band (20) minus lower bollinger band (20)} add column A
A reached a new 90 day low
Close > 2 and average volume (30) > 300000
]


Change 90 day low to what you want.

See ya
David

data-miner
11 posts
msg #152222
Ignore data-miner
5/17/2020 12:46:16 PM

May I make a few suggestions?

Be sure to Draw the xMomStudy because, this appears to be an important graph of the Carter Squeeze.

I prefer the custom ema length to be 5

I Added dots to the xMomStudy to show where the squeeze is occurring, both above and below the bars are all green dots. I couldn't find a way to change the colors.


data-miner
11 posts
msg #152223
Ignore data-miner
5/17/2020 1:00:33 PM

Example
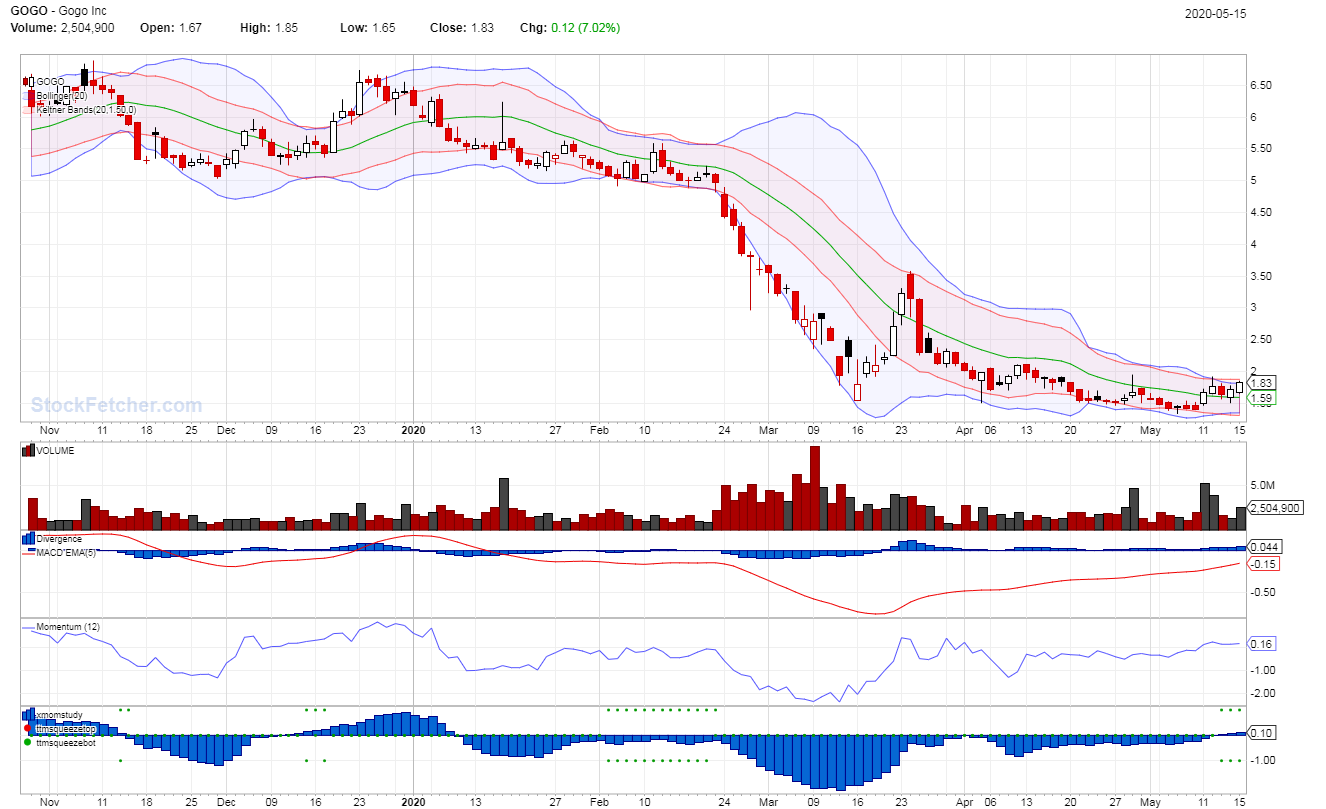

ron22
255 posts
msg #152224
Ignore ron22
5/17/2020 3:08:49 PM

data-miner, Please post the filter that includes the green dots. Thank you.

Also, what are the recommended entry and exit triggers to swing trade this filter? Thanks again for your help.

Mactheriverrat
3,135 posts
msg #152225
Ignore Mactheriverrat
5/17/2020 4:21:52 PM

Strange that you use GOGO as I'm am watching it also. The below code is using the Guppy MMA's traders short term group as they are rolling over meaning they are becoming bullish.

Set{cnt217,count( eMA(2) > eMA(17) ,1)}
draw cnt217
Set{cnt217b,count( eMA(2)< EMA(17) ,1)}

draw cnt217b

*/ 217 is number of consecutive days ema(2) above (+)/below(-) previous EMA(17) */
set{217b,days( ema(2) is above EMA(17) ,250)}
set{217a,days( ema(2) is below EMA(17) ,250)}
set{217, 217a - 217b} and add column 217 {217}
do not Draw 217


draw ema(2)
draw ema(3)
draw ema(4)
draw ema(5)
draw ema(6)
draw ema(7)
draw ema(8)
draw ema(9)
draw ema(10)
draw ema(11)
draw ema(12)
draw ema(13)
draw ema(14)
draw ema(15)
draw ema(16)
draw ema(17)

data-miner
11 posts
msg #152226
Ignore data-miner
modified
5/17/2020 6:20:12 PM

Here are my modifications to novacane32000's original post above
See the "PlotType" below for the addition of the dots.

I also prefer having the Keltner to 1.5

I am no expert at the use of the TTM Squeeze I had read one article that suggested a keltner to bollinger ratio (KBRatio) of 1 to signal an alert. I added a column for it and i have been looking at those above .90 that were below .90 two days ago

I have also been experimenting with the price crossing the upper (or lower) bollinger / keltner bands.
and perhaps xMomStudy crossing above 0.

Finally in what I have been experimenting with, I do not draw any charts except price, volume, xMomStudy and momentum(12). I removed all columns that I wasn't interested in. But I left them in this in case someone wants to keep them

Fetcher[
/* Keltner Bollinger Squeeze Filter Modified*/

set{xUp, days(upper bollinger(20,2.0) above the Upper Keltner Band(20,1.5) , 100 )}
set{xDn, days(lower bollinger(20,2.0) below the Lower Keltner Band(20,1.5) , 100 )}

set{xUBB, days(high >= upper bollinger(20,2.0) , 100 )}
set{xLBB, days(low <= lower bollinger(20,2.0) , 100 )}

set{xRange, high - low }
set{xRPCT, xRange / atr(20) }

set{xMomStudy, cema(momentum(12), 5) }
set{xReturn1, xMomStudy + MACD Fast Line(12,26) }
set{xReturn, xReturn1 / 2 }

/* plots */

draw xUp
draw xDn on plot xUp

draw xRange
draw atr(20) on plot xRange

draw momentum(12)
draw macd(12,26,9)
draw xReturn

draw xMomStudy
draw line 0 on plot xMomStudy
PlotType{xMomStudy,zerobar}

set{TTMSqueezeTop, count(Upper Bollinger Band(20,2) < Upper Keltner Band(20,1.5),1)}
set{TTMSqueezeBotA, count(Lower Bollinger Band(20,2) > Lower Keltner Band(20,1.5),1)}
set{TTMSqueezeBot, TTMSqueezeBotA * -1}

draw TTMSqueezeTop on plot xMomStudy
PlotType{TTMSqueezeTop,dot}

draw TTMSqueezeBot on plot xMomStudy
PlotType{TTMSqueezeBot,dot}

set{Kwidth, Upper Keltner Band(20,1.5) - Lower Keltner Band(20,1.5)}
set{Bwidth, Upper Bollinger Band(20,2) - Lower Bollinger Band(20,2)}
set{KBRatio, Bwidth / Kwidth}
add column KBRatio


/* column displays */

add column xUp
add column xDn

add column xUBB
add column xLBB

add column xRange
add column atr(20)
add column xRPCT
add column xReturn


/* squeeze selection */

upper bollinger(20,2.0) below the Upper Keltner Band(20,1.5)

lower bollinger(20,2.0) above the Lower Keltner Band(20,1.5)
xMomStudy above 0
price near upper bollinger(20,2)
/* price, volume selection */

close above 1
volume above 300000
]


data-miner
11 posts
msg #152227
Ignore data-miner
5/17/2020 6:24:30 PM

Mactheriverrat - thank you for posting your code, I'm going to take a closer look at it.

ron22
255 posts
msg #152230
Ignore ron22
5/17/2020 10:38:40 PM

data-miner, Thank you very much for posting the filter and for your input on possible entries and exits. Member input and feedback is the main reason why I like SF.

StockFetcher Forums · General Discussion · John Carter - Squeeze<< 1 2 3 >>Post Follow-up

*** Disclaimer *** StockFetcher.com does not endorse or suggest any of the securities which are returned in any of the searches or filters. They are provided purely for informational and research purposes. StockFetcher.com does not recommend particular securities. StockFetcher.com, Vestyl Software, L.L.C. and involved content providers shall not be liable for any errors or delays in the content, or for any actions taken based on the content.


Copyright 2022 - Vestyl Software L.L.C.Terms of Service | License | Questions or comments? Contact Us
EOD Data sources: DDFPlus & CSI Data Quotes delayed during active market hours. Delay times are at least 15 mins for NASDAQ, 20 mins for NYSE and Amex. Delayed intraday data provided by DDFPlus


This site is protected by reCAPTCHA and the Google Privacy Policy and Terms of Service apply.