| StockFetcher Forums · General Discussion · 2 standard deviations | << >>Post Follow-up |
| dashover 224 posts msg #131810 - Ignore dashover |
10/7/2016 10:21:03 AM If you wanted to buy from a watchlist of solid stocks... those that have moved 2 standard deviations from their average would you simply use outside the Bollinger to accomplish that? or is there a better way to show a 2 SD move? Thanks! Dash |
| four 5,087 posts msg #131821 - Ignore four modified |
10/7/2016 7:57:36 PM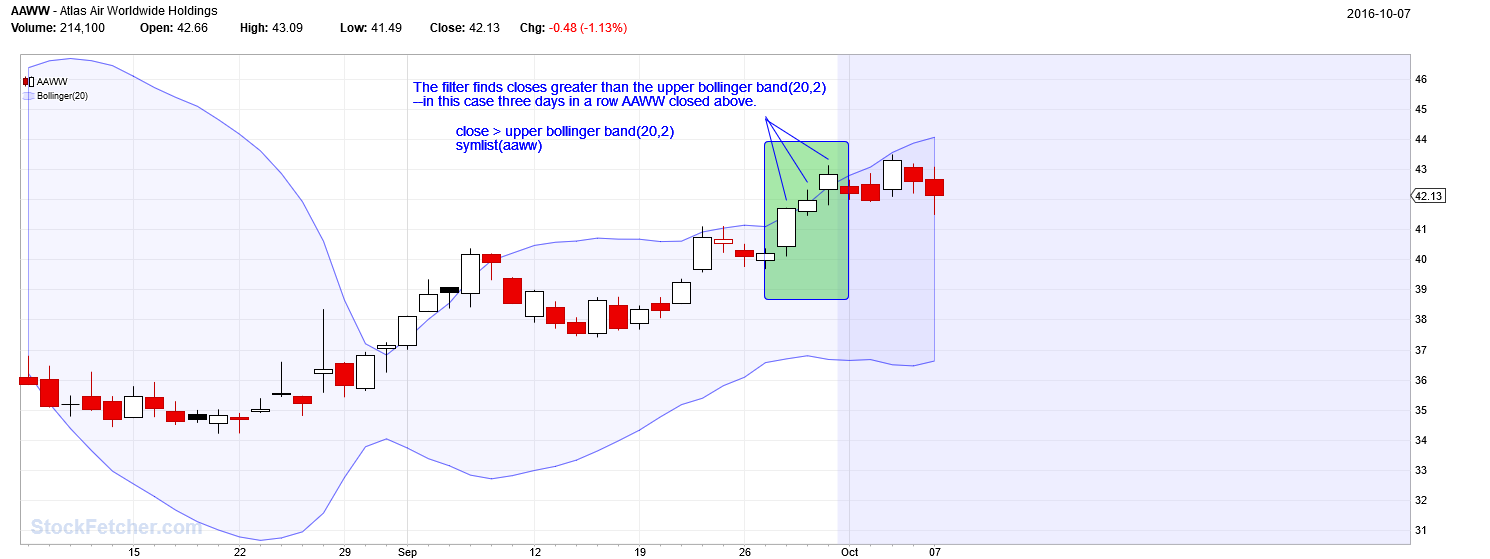 Does this link help? http://stockcharts.com/school/doku.php?st=standard+deviation&id=chart_school:technical_indicators:bollinger_bands |
| Kevin_in_GA 4,599 posts msg #131822 - Ignore Kevin_in_GA |
10/7/2016 8:33:58 PM You can also use the Bollinger Oscillator http://www.stockfetcher.com/forums2/Indicators/Bollinger-Oscillator/266 In this case you look for stocks within your watchlist that have a Bollinger Oscillator value above 100. |
| traderseb 36 posts msg #131837 - Ignore traderseb |
10/9/2016 6:19:51 AM The oscillator range value can't exceed 100 if the range is -100 to 100. |
| Kevin_in_GA 4,599 posts msg #131838 - Ignore Kevin_in_GA |
10/9/2016 8:58:14 AM No - the value of 100 or -100 corresponds to the Upper and lower BBs. Here is the description from the link I included: Bollinger Oscillator Parameters Period Sigma Usage Bollinger Width Oscillator(period) Bollinger Oscillator(period) Description The Bollinger Width Oscillator is a simple extension of the Bollinger Bands using the closing price. Essentially the Bollinger Width Oscillator computes the position of the closing price relative to the width of the Bollinger Bands. This oscillator ranges from -100 to 100. Where a value above 100 indicates the closing price is above the upper band and a value of -100 would indicate the price is below the lower band. Similarly, a value at 0 indicates the price is centered on the median Bollinger line (or moving average.) Examples |
| StockFetcher Forums · General Discussion · 2 standard deviations | << >>Post Follow-up |