| StockFetcher Forums · General Discussion · MACD(12,26,9) Fast Line crossed below 0 | << 1 2 >>Post Follow-up |
| tgoo426193 19 posts msg #127512 - Ignore tgoo426193 modified |
3/6/2016 11:04:52 AM I'm confused as to what point in time that this filter phrase is pointing to? (Or how to define what I'm hunting) MACD(12,26,9) Fast Line below 0 I simply am trying to find stocks that have the MACD lines sitting below the "0" line at the close of the last day. (bottom of the hump, if you will) If I enter the phrase as seen, I get results where the lines are above the "0" . I tried adding "at close", "near close" etc. What am I missing? ALSO - I would of course just add the above phrase to my already made filter, thus narrowing the results a bit. Now, if I wish to keep all the original results, can I build a column that will apply a figure to each symbol of which I can sort to bring all the candidates to the top that have the MACD sitting at the bottom? And then I could eliminate the phrase from my criteria. |
| four 5,087 posts msg #127513 - Ignore four modified |
3/6/2016 11:33:26 AM MACD lines sitting below the "0" line --- Both lines must be in the filter-- MACD(12,26,9) Fast Line below 0 MACD(12,26,9) Slow Line below 0 Perhaps... 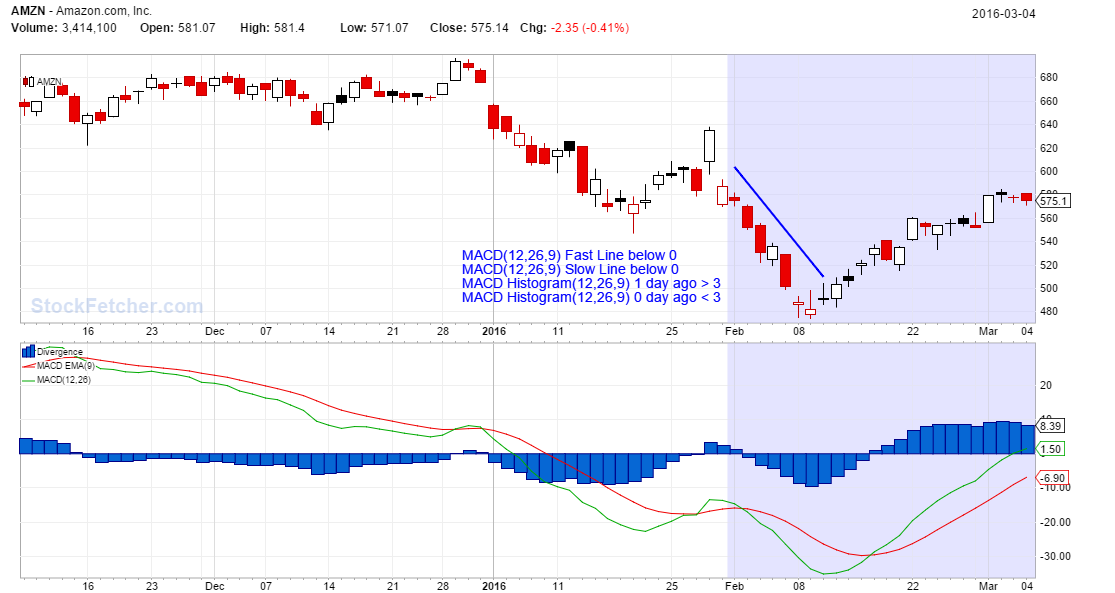 |
| tgoo426193 19 posts msg #127514 - Ignore tgoo426193 |
3/6/2016 11:40:30 AM I think I did tried that four, but I'll try again. Did you see my edited post/question above? |
| tgoo426193 19 posts msg #127515 - Ignore tgoo426193 |
3/6/2016 11:46:02 AM I just tried it again and TVIX showed up in the results. Both lines are clearly above the 0 on my chart (Scottrade Elite) |
| four 5,087 posts msg #127516 - Ignore four |
3/6/2016 11:47:45 AM Compare this to yours... |
| four 5,087 posts msg #127517 - Ignore four modified |
3/6/2016 11:52:02 AM Both below MACD(12,26,9) Fast Line below 0 MACD(12,26,9) Slow Line below 0 symlist(tvix) 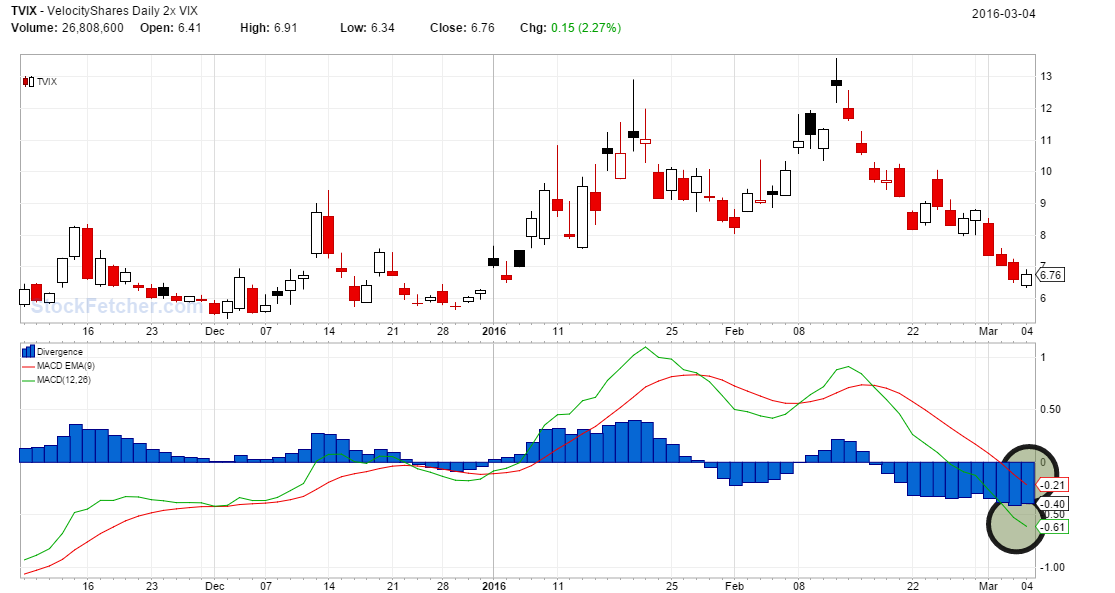 |
| tgoo426193 19 posts msg #127518 - Ignore tgoo426193 |
3/6/2016 11:56:34 AM OK, I pulled up a daily, 2 month chart of TVIX and they are below the 0 on that. I was looking at a 10 min 4 day chart, on which they are above. Your AMZN sample is similar on the daily chart, and still below on my 10 min, 4 day chart |
| tgoo426193 19 posts msg #127519 - Ignore tgoo426193 |
3/6/2016 11:58:38 AM Is there a way to request a shorter time period? |
| four 5,087 posts msg #127520 - Ignore four modified |
3/6/2016 12:00:40 PM Change the values... for a different time period for example : MACD(10,13,4) Fast Line below 0 MACD(10,13,4) Slow Line below 0 symlist(tvix) Remember StockFetcher is not really for intraday... "EOD Data sources: DDFPlus & CSI Data Quotes delayed during active market hours. Delay times are at least 15 mins for NASDAQ, 20 mins for NYSE and Amex. Delayed intraday data provided by DDFPlus" |
| tgoo426193 19 posts msg #127521 - Ignore tgoo426193 modified |
3/6/2016 12:03:12 PM I do use 10-18-9 & I tried it both with those & default settings I don't use SF for intrady. Just grab my list in the morning |
| StockFetcher Forums · General Discussion · MACD(12,26,9) Fast Line crossed below 0 | << 1 2 >>Post Follow-up |