| StockFetcher Forums · General Discussion · Moving averages and trends | << 1 2 3 4 >>Post Follow-up |
| graftonian 1,089 posts msg #128500 - Ignore graftonian |
5/16/2016 6:42:16 PM It appears that the ema13 is, indeed a good indicator of beginning trends but backing it up with another indicator increases the chance of success. In this exercise I used Williams %r(60) crossing above -70. So entry would be x above ema(13) followed shortly(a day, or 2, or 3) by williams%R above -70. I used an average of open, high, low, and close to represent the security, primarily to increase readability, and added a few bells and whistles, to the same end. For some reason the results for the filter differ here on the forum . Todays pick is CZR |
| Mactheriverrat 3,135 posts msg #128507 - Ignore Mactheriverrat modified |
5/17/2016 1:58:06 AM Nice chart Graff! There have been some posters here on Stockfetcher in the past that used Average Day Range(30) above 8.00. I like Average Day Range(30) above above 4.00 . One can play with Average Day Range(30) to their own taste. It helps getting slow mover's out of the way . Just saying. The Key is the trend of the EMA(13) or if one wants to use say EMA(9) how the averages start moving up. In this chart see how more volume on bullish days head towards the resistance line. 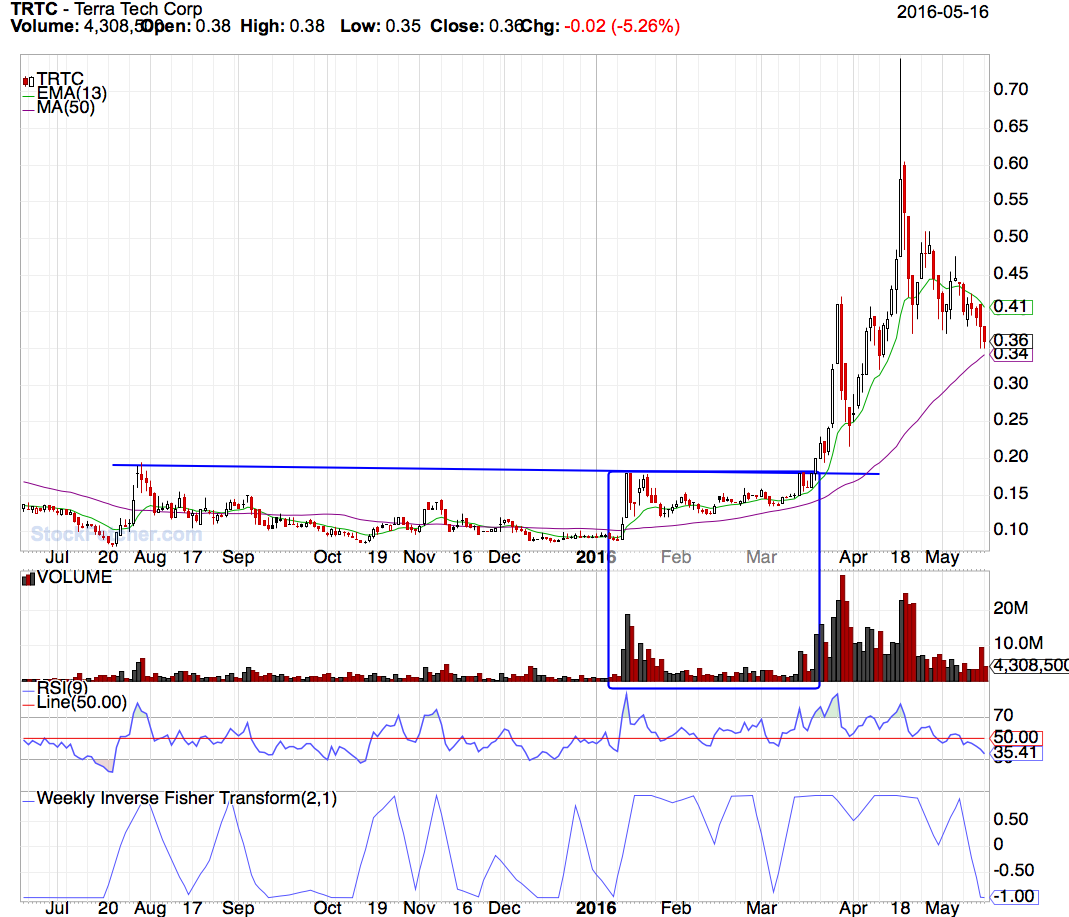 If one could take every thing off the chart and just see a line like EMA(13) or EMA(10) or EMA(9) vs price. When you see the line start moving up or down then thats the trend. |
| Mactheriverrat 3,135 posts msg #128508 - Ignore Mactheriverrat |
5/17/2016 7:20:41 AM Hey Graff Here is some code telling how many days EMA(13) has been up or down. BxB is number of consecutive days Ema(13) above (+)/below(-) previous ema(13) and set{BBb,days( Ema(13) is above ema(13) 1 day ago,100)} set{BBa,days( Ema(13) is below ema(13) 1 day ago,100)} set{BxB, BBa - BBb} and add column BxB {B_x_B} do not Draw BxB |
| graftonian 1,089 posts msg #128513 - Ignore graftonian |
5/17/2016 12:05:46 PM Looking at the volatility of these trades, it strikes me that position sizing is a must. I personally like an initial stop of 2 x atr(10), but this can be changed as well the size of your own poke, and how much you want to win/lose. I add this to my prior filter. Thanks again to my coding mentor, kevin_from_ga. fetcher[SET{FOLIO_CASH,10000}/*to suit your piggy bank*/ SET{CASH_PER_TRADE, FOLIO_CASH /10}/*how much of stash do you want bet?*/ SET{RISK_PER_TRADE, FOLIO_CASH / 100}/*and how much to risk*/ SET{2ATR, ATR(10) * 2} SET{STOPLOSS, CLOSE - 2ATR}/*set stoploss at 2 x ATR(10)*/ DRAW PRICE LINE AT STOPLOSS /*MONEY MANAGEMENT*/ SET{SL, CASH_PER_TRADE / CLOSE} SET{RL, RISK_PER_TRADE / 2ATR} SET{LS1, MIN(SL, RL)}/*lot size is minimum of cash or risk*/ SET{LS, ROUND(LS1)} SET{CASH_REQ, LS * CLOSE} ADD COLUMN SEPARATOR ADD COLUMN LS{LOT_SIZE} ADD COLUMN CASH_REQ ADD COLUMN 2ATR ADD COLUMN STOPLOSS] |
| StockFetcher Forums · General Discussion · Moving averages and trends | << 1 2 3 4 >>Post Follow-up |