| StockFetcher Forums · General Discussion · My favs | << 1 2 >>Post Follow-up |
| klynn55 747 posts msg #118330 - Ignore klynn55 |
2/23/2014 1:30:47 AM the socratic method uses a free and open discourse , that discludes you, you are anything but open. thus goes the discourse. |
| Mactheriverrat 3,135 posts msg #118334 - Ignore Mactheriverrat modified |
2/23/2014 3:19:26 AM Seems negativity has broken out on the SF forums. If I wanted negativity I would turn on Fox and CNN news on 2 different TV's and turned them towards each other. They could bad mouth each other for hours on in. IMHO- Negativity is wasted energy! STUPID! -------------------------------------------------- Now getting back to my favorites thread. I rather watch stocks above the EMA(13) or even the EMA(21). To me breaking those above or below is a sign of strength or weakness. Using TRIX(2,3), macd histogram(2,6,3),fast stochastic fast %k(5,2) as early signs of change in direction. Looking at ARWR and the TRIX(2,3) fast and slow lines . One can see where buy and sell positions are while ARWR is riding up the EMA(13). |
| Mactheriverrat 3,135 posts msg #118338 - Ignore Mactheriverrat modified |
2/23/2014 2:31:06 PM My idea is find and or build a filter that picks up stocks like ARWR. or even TSLA most of last year as it rode up the EMA(13). Look at ARWR. My bet is its a short term sell back towards the EMA(13) or there abouts. Then another pop off the ema(13). I've looked at a million filters and read they were backtested to the point of no returen. IMHO- Keep it simple, trade the setup your looking for. Just saying! |
| shillllihs 5,975 posts msg #118340 - Ignore shillllihs |
2/23/2014 3:29:13 PM Nice job. But what do we make of the other crap it also picks up? Let me know. |
| Mactheriverrat 3,135 posts msg #118341 - Ignore Mactheriverrat modified |
2/23/2014 3:59:19 PM To each their own. One can just use the TRIX(2,3) fast and slow lines when they cross- Seems to me when the TRIX(2,3) histogram is one day up from its low below 0 the next day the Bulls start coming back in. |
| Mactheriverrat 3,135 posts msg #118347 - Ignore Mactheriverrat |
2/23/2014 6:17:39 PM I myself like TRIX(2,3) and its histogram as to me it shows more when the bears have lost steam on the short side and the Bulls start coming back as long as the price stays above the EMA(13). To me ARWR is a prime example. Just saying. |
| alf44 2,025 posts msg #118405 - Ignore alf44 modified |
2/27/2014 2:52:09 PM . ... this chart set-up uses an 8 period Fisher Transform along with another 8 period Fisher Transform plotted 1 day ago ... . 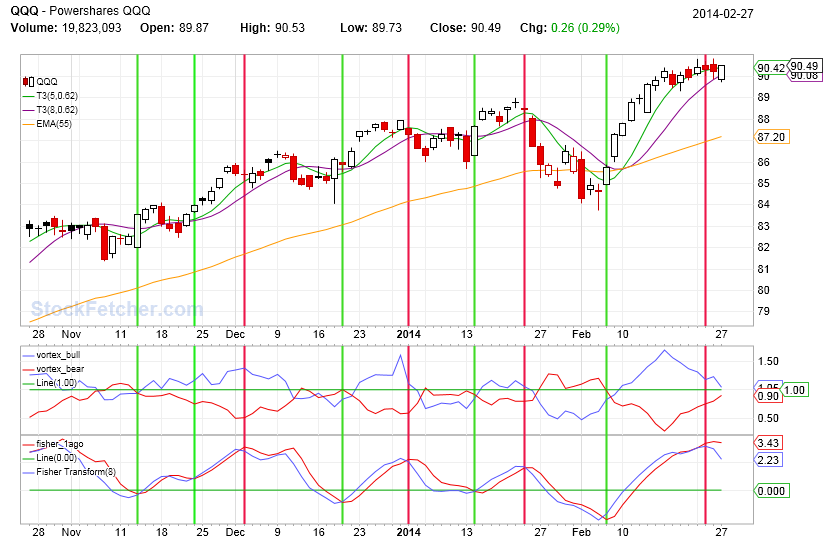 . BUYS and SELLS are marked ! I added a few other goodies as well ! . . |
| shillllihs 5,975 posts msg #118408 - Ignore shillllihs |
2/27/2014 6:20:33 PM Will look into your chart. You ever notice the turning points that often occur at +2.00 +5.00 -2.00 -5.00? |
| StockFetcher Forums · General Discussion · My favs | << 1 2 >>Post Follow-up |