| StockFetcher Forums · General Discussion · New charts ???? | << 1 ... 6 7 8 9 10 >>Post Follow-up |
| stockfetcher 979 posts msg #116687 |
11/12/2013 7:26:29 AM Hi, At this time we recommend you use the vertical line tool to identify a region: 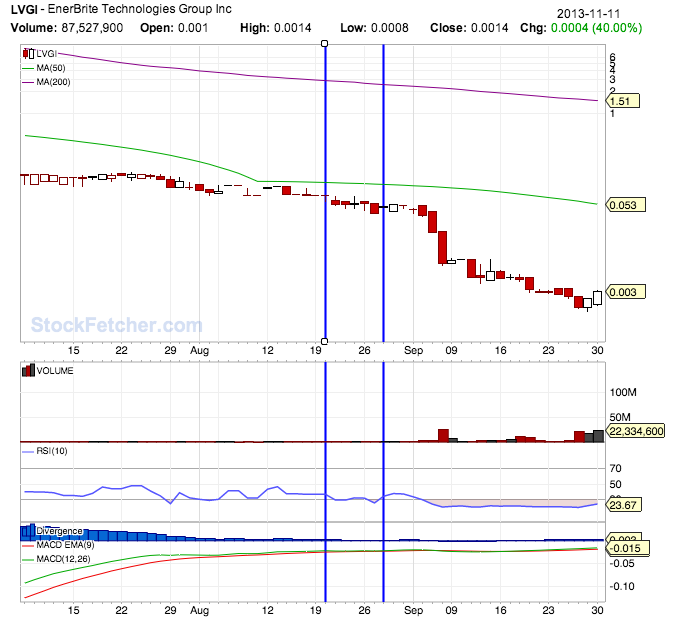 The box feature is tied to a plot's pricing value (which is why dragging is blocked at the bottom price plot). You can work around this by drawing the box from the bottom of the chart and dragging to the top. 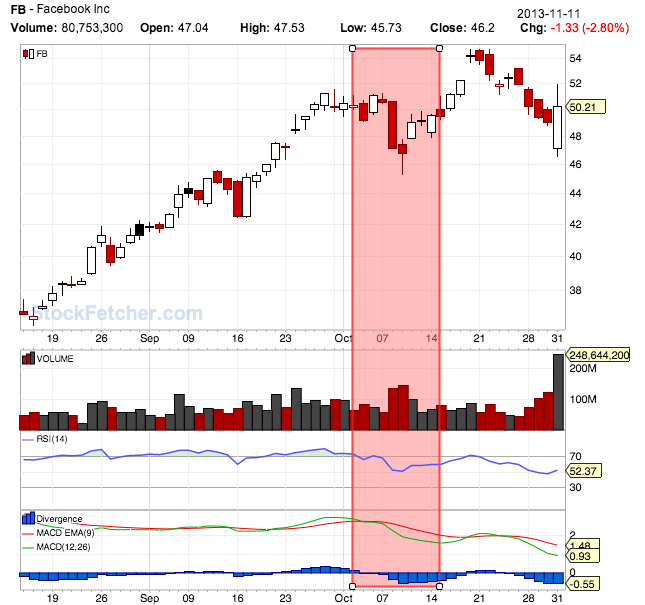 We hope this helps, StockFetcher.com Support |
| SAFeTRADE 630 posts msg #116689 - Ignore SAFeTRADE |
11/12/2013 8:07:23 AM Thanks |
| alf44 2,025 posts msg #116698 - Ignore alf44 modified |
11/12/2013 5:12:10 PM FYI : The displaying of a candle whose ... ... Close is > than it's Open ... but, it's Close is < Previous Close (ie. a "hollow" RED candle) ... is pretty difficult for me to discern (especially) on the white background of the "new" charts ! ----- Check'em out here if you like... ----- Can anything be done about this ? TIA . |
| stockfetcher 979 posts msg #116700 |
11/12/2013 5:40:16 PM Hi, Great suggestion. We made the change to the popup charts. If this looks good to you we'll update the results charts as well. 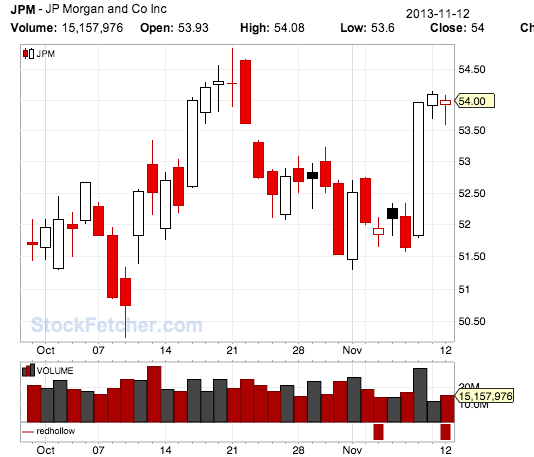 Thanks, StockFetcher.com Support |
| alf44 2,025 posts msg #116701 - Ignore alf44 |
11/12/2013 6:09:47 PM ... GO for it ... and thank you ! . |
| alf44 2,025 posts msg #116711 - Ignore alf44 modified |
11/12/2013 10:38:57 PM heypa (I hope you're still around) ... ----- "heypa: "Is there any chance that you will ever reinstate the Java charts. A simple non qualified yes or no will suffice." SF: "... we have no plans to return the old flash and gif charts." heypa: "Then I'm done." ----- REALLY ? REALLY ??? Once upon a time ... I owned a Motorola flip phone (still own it ... makes a great lil door stop) ! It was a nice little phone and at the time I was pleased with it ... fast forward ... I NOW have an Apple iPhone that I love ! . Once upon a time ... I owned an Apple Newton (still own it ... makes a great lil door stop) and at the time it was the greatest thing since "sliced bread" ... fast forward ... I NOW have an Apple iPad (2 of'em) that I love ! . Once upon a time ... I had a 4:3 aspect ratio standard definition TV (alas, it's in a dumpster somewhere) ... fast forward ... I am NOW happily immersed in the 16:9 aspect ratio world of HiDef Television and loving it ! . I guess (in a nutshell) ... just sayin' ... technology is changing ... RAPIDLY ... quit whining and get on board OR get left behind !!! SF has ALWAYS made changes (to the site) in an effort to improve the experience here (I have been here since 2003 btw) ... and I have NO doubt these "new chart" changes will be for the better ! With ALL due respect ... you're being a bit obtuse ! Dinosaurs failed to adapt ... Dinosaurs are long gone ... Don't be a Dinosaur !!! Hope you reconsider !!! . |
| heypa 283 posts msg #116712 - Ignore heypa |
11/13/2013 1:51:42 AM ALF THIS IS NOT A TECHNOLOGY CHANGE. i STILL HAVE A 4 FUNCTION CALCULATOR i BOUGHT MY SON WHEN HE WENT TO THE AIR FORCE ACADEMY IN 1973 OR 74.COST ME $100. DAMN ALL CAPS,SORRY.i don't know the reason for this change but i doubt it was improved technology. Perhaps a cost containment action. I have many more problems than have been reported. Many of them intermittent .Many more than my old deficient brain can handle. Yes I can now see stock prices back two years, but I don't need them therefore they are interesting though not useful. Took me a while to figure out the double day line.The chart area is smaller. The trend line must be re-originated with each new stock selection. Every line I draw is drawn 8 to 30 % above where I want it,The price chart is the only area that can be size changed and when expanded is too large to be wholly seen. Very important to me are log charts(all I have used for many years). when I questioned years ago about prices all jammed up against the chart top I was told not to us log charts but to switch to html charts. I like to chain trend lines to more clearly see price acceleration and deceleration. Good luck doing it on these charts. I liken this unexpected charting change to the unaffordable care act. Not well thought out with too many problems. Who knows how long it will take to fix. For me I know only that it will not be fixed to my satisfaction. I use a very simple screen I can do on yahoo for free and I'm sure I can find a chart program without glitches for the same price. It will probably not be as good as our previously dropped charts,but I'll live with it. I have no beef with the fine helpful folks on stock fetcher only with the management. Many of you are far more skilled than I and I have to do all my analysis visually which is why I'm so pissed about the charts. Sorry for the two finger rant. Took a long time to type but I wanted you to know some of the reasons. I liked my little rut and I don't make changes easily, I recognize when change is necessary and I really think I have to now. |
| Mactheriverrat 3,135 posts msg #116713 - Ignore Mactheriverrat |
11/13/2013 2:48:27 AM It would be nice if somehow SF could add some type of button where if one drew support and resistance lines that they would stay saved on a chart in a pop up window as well as the results window at a future SF upgrade. See the blue support and resistance lines . |
| stockfetcher 979 posts msg #116716 |
11/13/2013 6:37:06 AM @heypa: Please try refreshing your browser. We resolved this exact issue several days ago. Also, if you could provide us screenshots at support@stockfetcher.com that would be the most helpful. Here is a good topic on creating a screenshot: http://email.about.com/od/netiquettetips/qt/screenshot_win.htm Screen shots provide us a number of details that could shed light on the problems you're seeing. * Note - copy-paste of the html / page you're viewing does not provide the information we need. Thanks! StockFetcher.com Support |
| heypa 283 posts msg #116725 - Ignore heypa |
11/13/2013 11:54:08 AM No picture required. When I move my mouse from right to left over the chart without clicking and holding the left or right button it causes the time period to follow the mouse arrow directional movement. That's damned aggravating. |
| StockFetcher Forums · General Discussion · New charts ???? | << 1 ... 6 7 8 9 10 >>Post Follow-up |