| StockFetcher Forums · Stock Picks and Trading · DUST - Looks ready for Breakout. | << 1 ... 4 5 6 7 8 ... 9 >>Post Follow-up |
| Mactheriverrat 3,135 posts msg #131021 - Ignore Mactheriverrat |
9/9/2016 3:10:55 PM Looking at Guppy longer term averages, resistance, and support lines . One can see longer term investors are moving out of NUGT 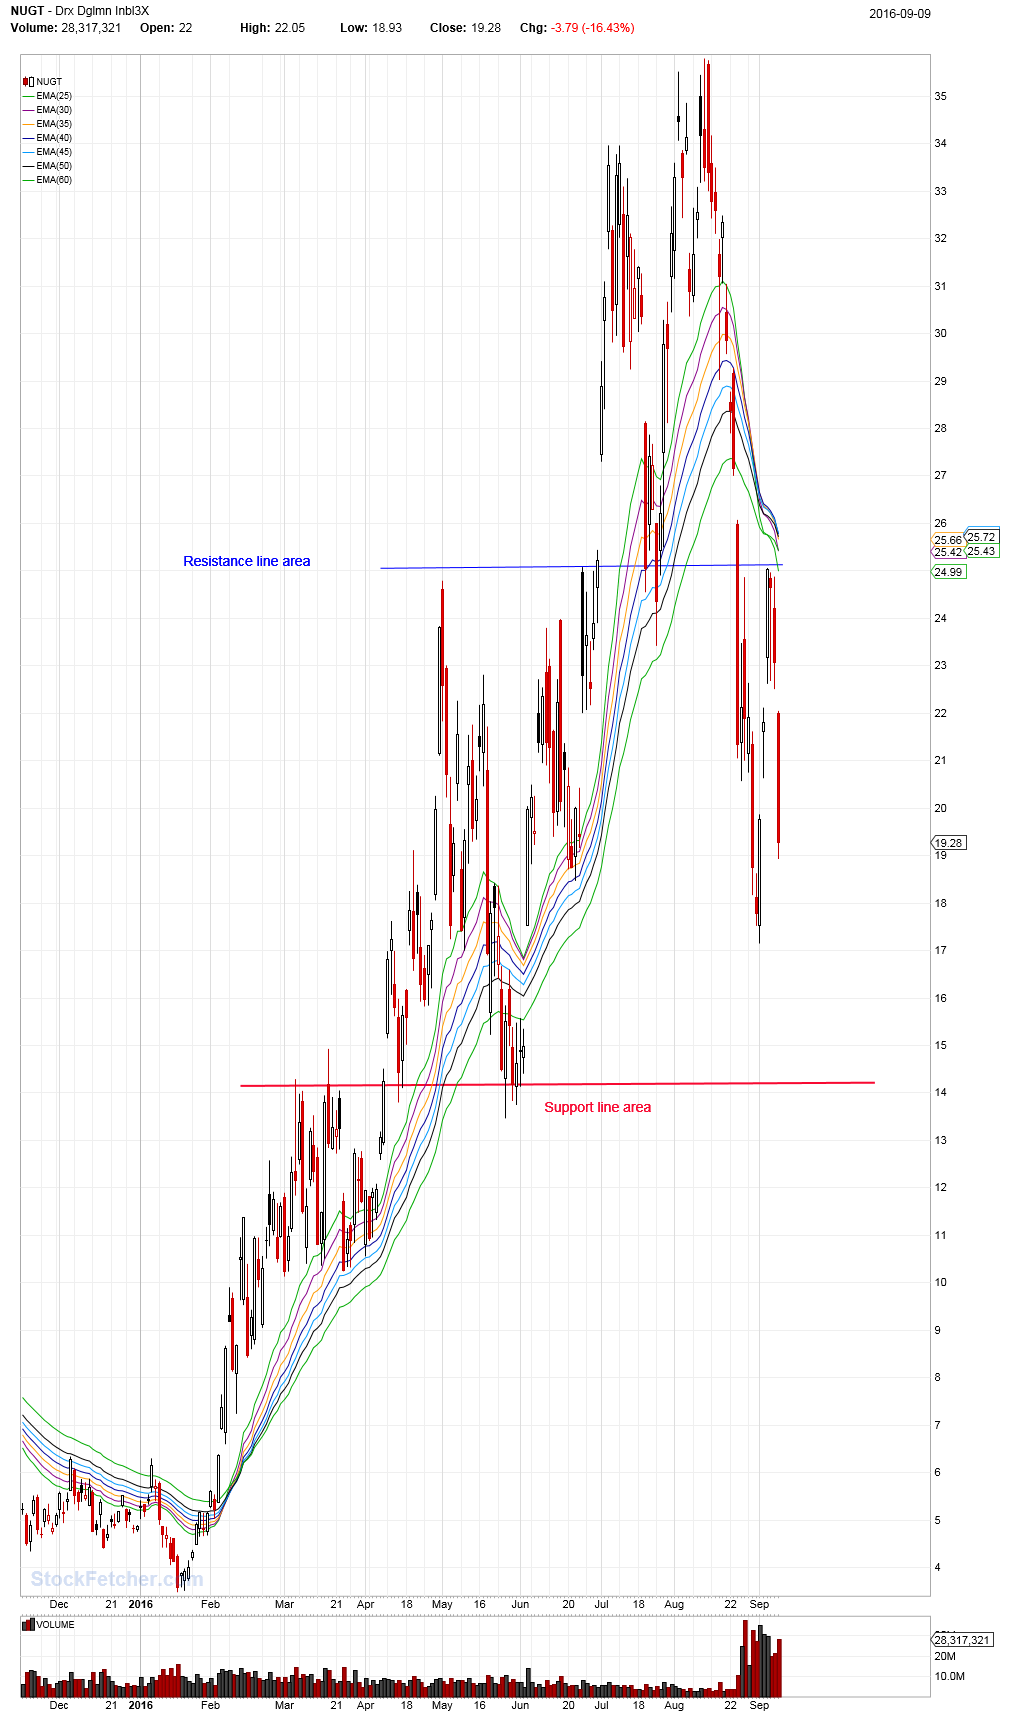 |
| johnpaulca 12,036 posts msg #131022 - Ignore johnpaulca |
9/9/2016 3:11:00 PM AU....probably get it around for $15ish |
| Mactheriverrat 3,135 posts msg #131023 - Ignore Mactheriverrat modified |
9/9/2016 3:15:27 PM If the support line is that area holds but to me long term is that investors are leaving. DUST is taking on more as people smell change. I will be watching the volume as traders change strength to the trend change 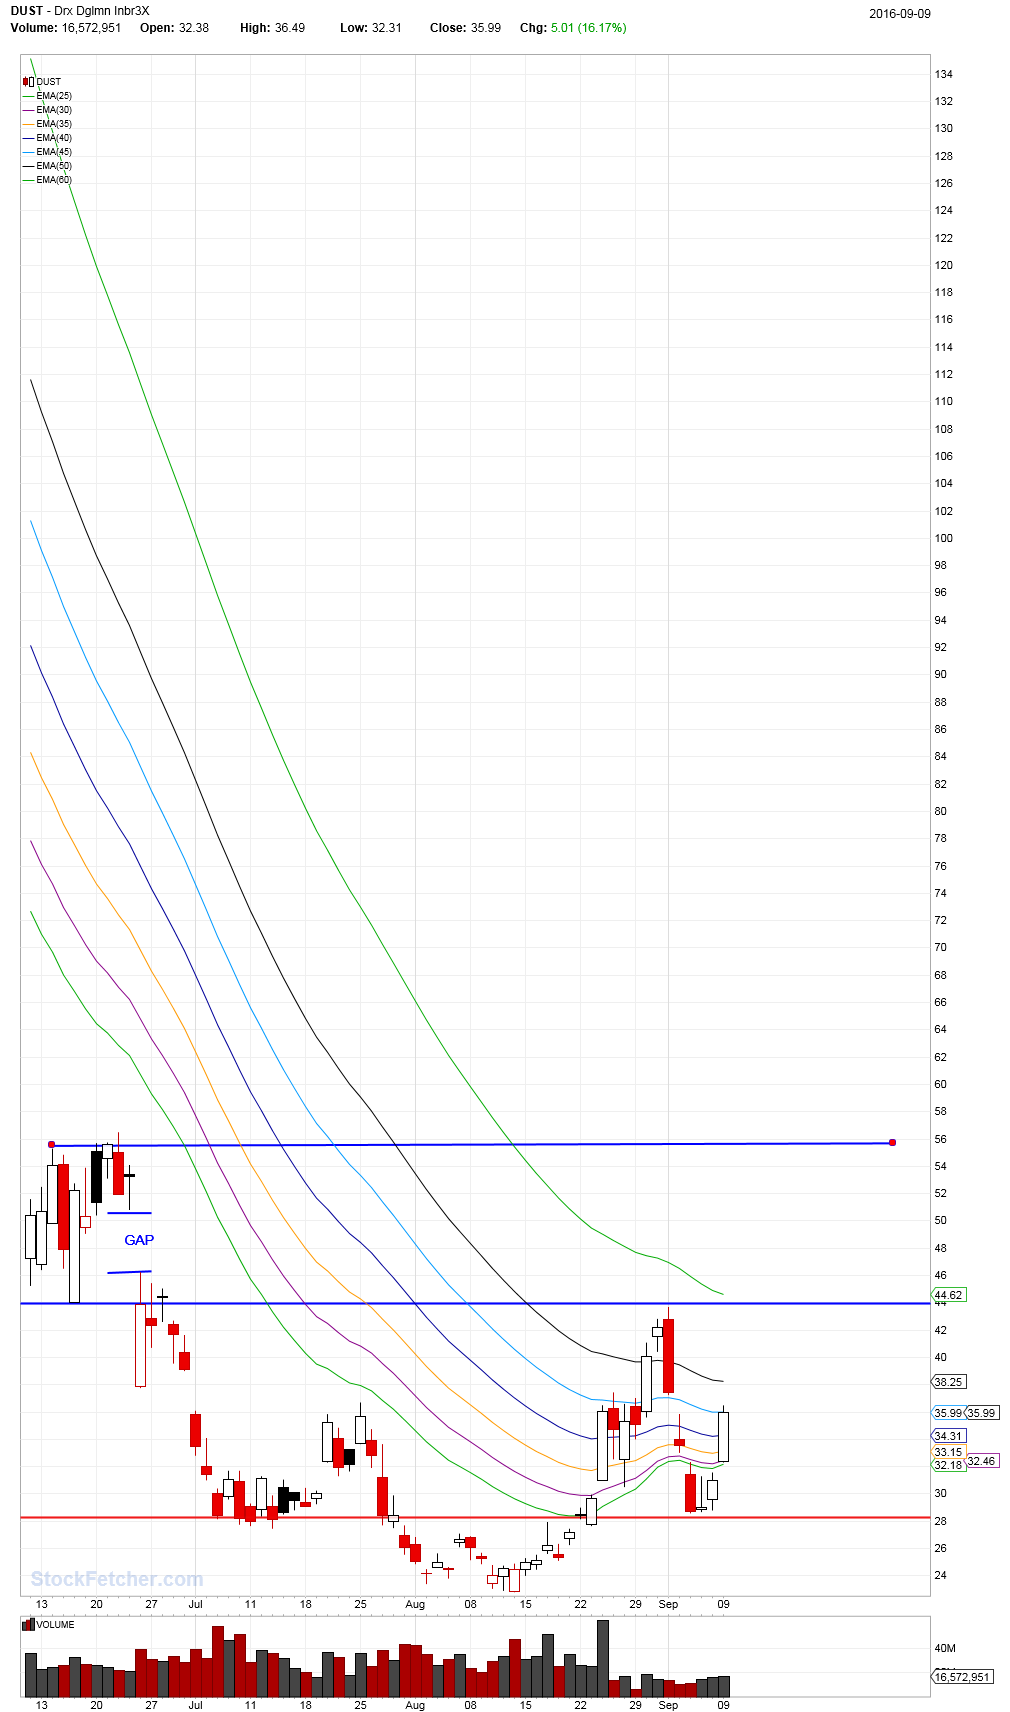 |
| Mactheriverrat 3,135 posts msg #131028 - Ignore Mactheriverrat |
9/9/2016 3:38:04 PM I'm not crazy holding over the weekend but DUST sure looks tasty. Maybe a small position. |
| Mactheriverrat 3,135 posts msg #131029 - Ignore Mactheriverrat |
9/9/2016 3:52:59 PM $35.79 stop -33.35 |
| karennma 8,057 posts msg #131054 - Ignore karennma |
9/10/2016 9:45:23 AM If ANYONE understands this chart, would you kindly explain it to me. For simplification purposes, please end your explanation with "and what this means to me is .... " THANKS! CLICK HERE |
| karennma 8,057 posts msg #131055 - Ignore karennma modified |
9/10/2016 9:54:05 AM What about this one? Sorry, I don't know HOW to post the actual pic of the chart ... just the link. If you know how, pls. feel free to do so ... CLICK HERE <<<<<----- Click Metals, then Gold |
| karennma 8,057 posts msg #131056 - Ignore karennma |
9/10/2016 11:12:40 AM "The negative reversal in miners and metals at the end of this week (and their failure to hold the rebound) signals that a larger and longer correction is playing out and more downside potential is directly ahead. " GOLD |
| four 5,087 posts msg #131067 - Ignore four |
9/10/2016 9:48:35 PM Silver 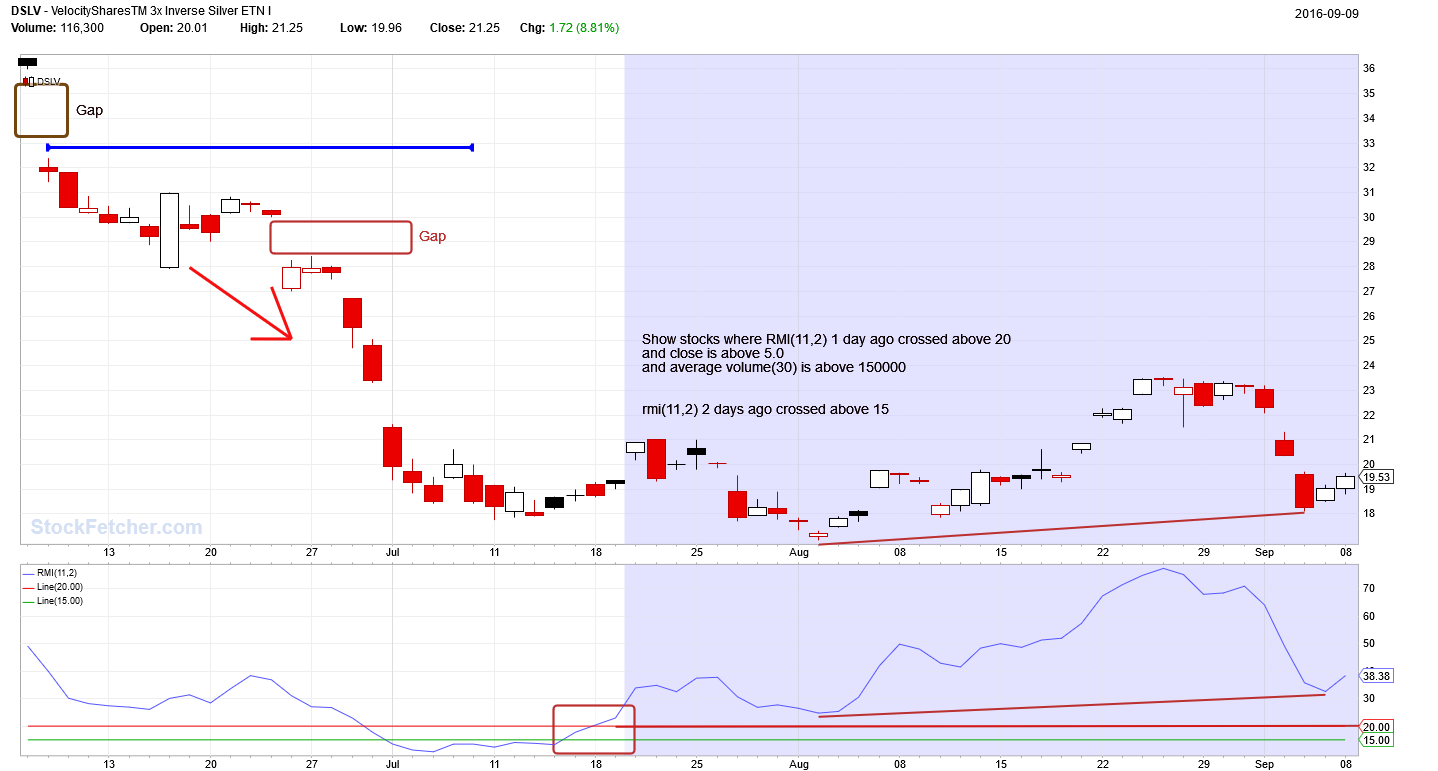 |
| four 5,087 posts msg #131068 - Ignore four modified |
9/10/2016 10:05:44 PM K, cotbase.com shows 3 types of traders: http://www.seeitmarket.com/how-to-use-the-cot-report-for-trading-13285/ The aggregate data is broken down into different commodity groups and by 3 Basic types of traders. 1. Commercial Hedgers 2. Large Trader 3. Small Speculators The Largest positions are typically held by commercial institutions or �hedgers� that have the indent actually taking delivery of the underlying commodity. Commercials are considered the most knowledgeable & are the most important group to keep tabs on. The next largest player is typically the �Large Speculators, which include Hedge Funds or CTA Trading Pools. These guys are much smaller than the overall commercial positions and on average do not have the intent on taking delivery of any of the under lying commodities they are trading. They are trading purely for profit and their actions are often less valuable to watch because they typically trade Future Spreads (Calendars) or Married positions (futures + options). The last group is call the Small Speculators or what some people call �dumb� money. This group is considered the small guy or 1 lot crowd. It is also typically seen that this group is the most ill-informed and thus should be �faded� or traded contrarian too. I have not really found this to be the case but there are times when this group does reach pretty extreme readings. Larry Williams talks about COT: |
| StockFetcher Forums · Stock Picks and Trading · DUST - Looks ready for Breakout. | << 1 ... 4 5 6 7 8 ... 9 >>Post Follow-up |