| StockFetcher Forums · Stock Picks and Trading · Generic | << 1 ... 46 47 48 49 50 ... 63 >>Post Follow-up |
| pthomas215 1,251 posts msg #129674 - Ignore pthomas215 |
7/8/2016 10:58:05 AM Four, interesting stuff. can I get your opinion on something? I use the filter below sometimes, but the only drawback is that it triggers after the bump. I miss the lions share of the escalation sometimes. I have used 'waiting for green" and others. just curious on your opinion as to how to catch this filter before the bump. |
| ThaGekko 139 posts msg #129675 - Ignore ThaGekko |
7/8/2016 11:22:13 AM Four How do you code "MA(LOW,10)"? |
| four 5,087 posts msg #129676 - Ignore four modified |
7/8/2016 11:48:08 AM ThaGekko 94 posts msg #129675 - Ignore ThaGekko 7/8/2016 11:22:13 AM Four How do you code "MA(LOW,10)"? ------------------------ Custom-EMA-and-Custom-Weighted-SMA ---------------------------- CMA(low,10) Reference: http://www.stockfetcher.com/forums2/Announcements/New-Functions-Custom-EMA-and-Custom-Weighted-SMA/32187/-1/32187 |
| four 5,087 posts msg #129678 - Ignore four modified |
7/8/2016 12:12:26 PM pt, Remember the market has been moving up lately. The odd are in favor of bull filters. Sometime it is luck and not smart that a filter looks good. Back test during a bear market and see if it keeps you out or reduces the number of hits. And to quote a few that have been on the board for a while... Money Management makes all the difference. Watch the poker players. http://tradingsim.com/blog/jesse-livermore-money-management/ http://www.pokerlistings.com/money-management http://www.tradeciety.com/money-management-turtle-traders/ Just a quick thought. The median bollinger band is the same as the MA. en.wikipedia.org Bollinger Bands consist of: an N-period moving average (MA) an upper band at K times an N-period standard deviation above the moving average (MA + Kσ) a lower band at K times an N-period standard deviation below the moving average LINE2: Looking to be outside the "norm" LINE4: AND momentum attempting to go up |
| pthomas215 1,251 posts msg #129679 - Ignore pthomas215 |
7/8/2016 12:15:50 PM once again four, much appreciated. |
| four 5,087 posts msg #129690 - Ignore four modified |
7/9/2016 12:34:27 AM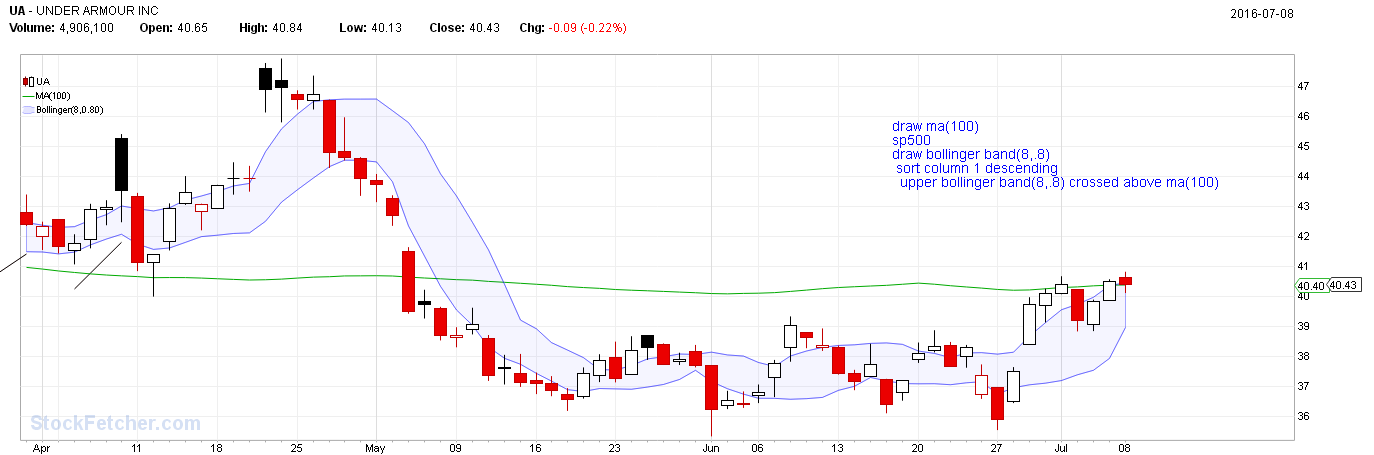 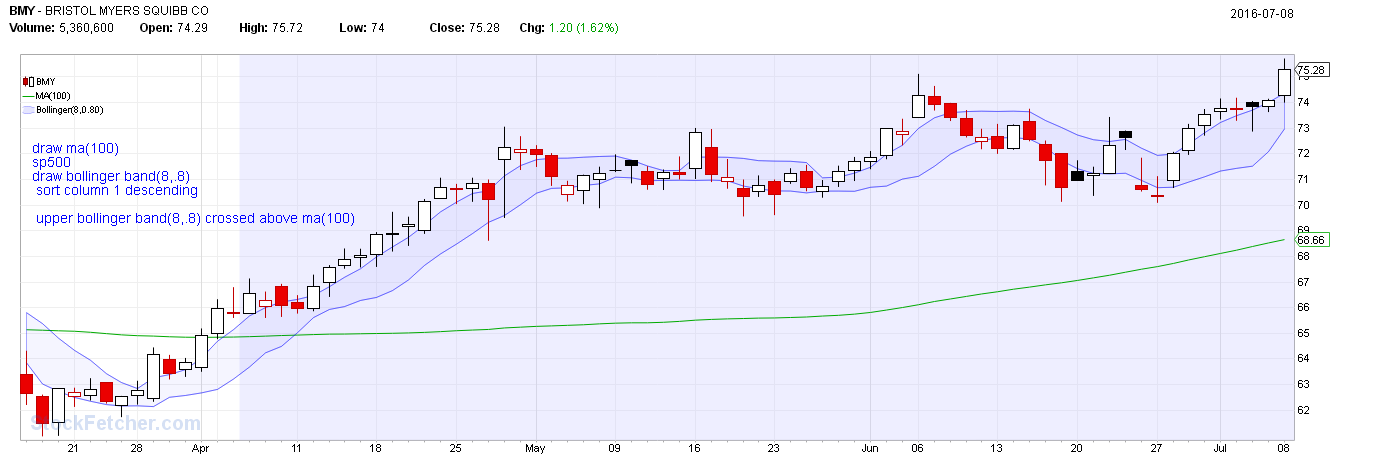 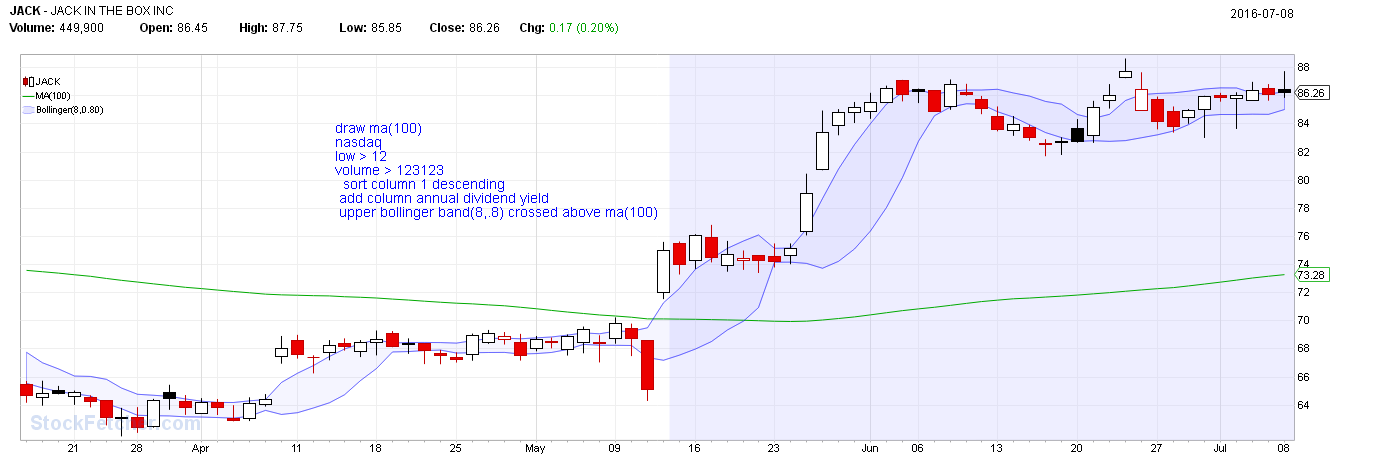 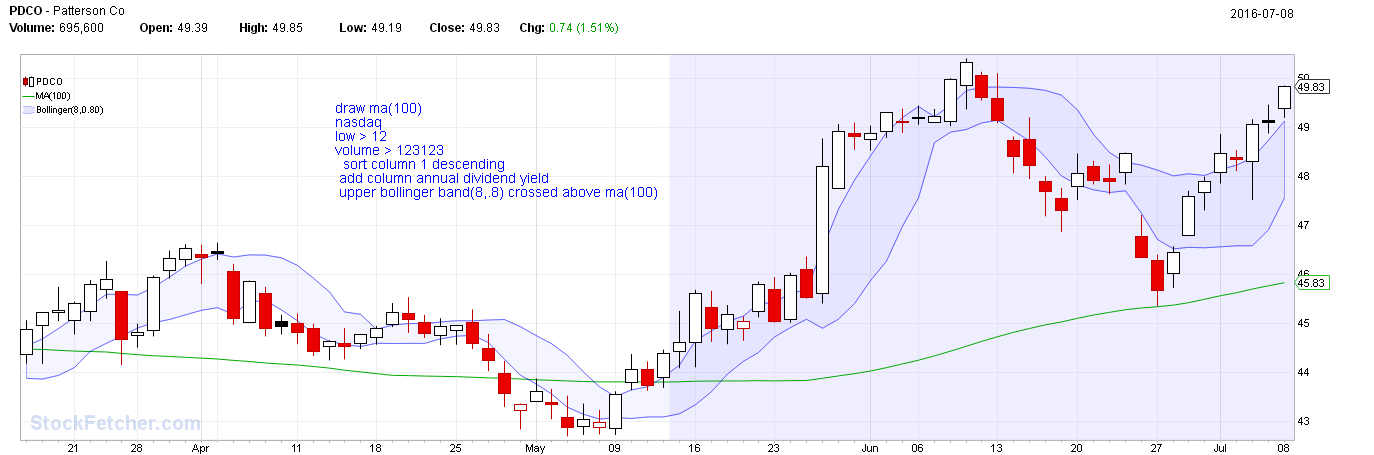 |
| four 5,087 posts msg #129704 - Ignore four modified |
7/9/2016 10:40:58 PM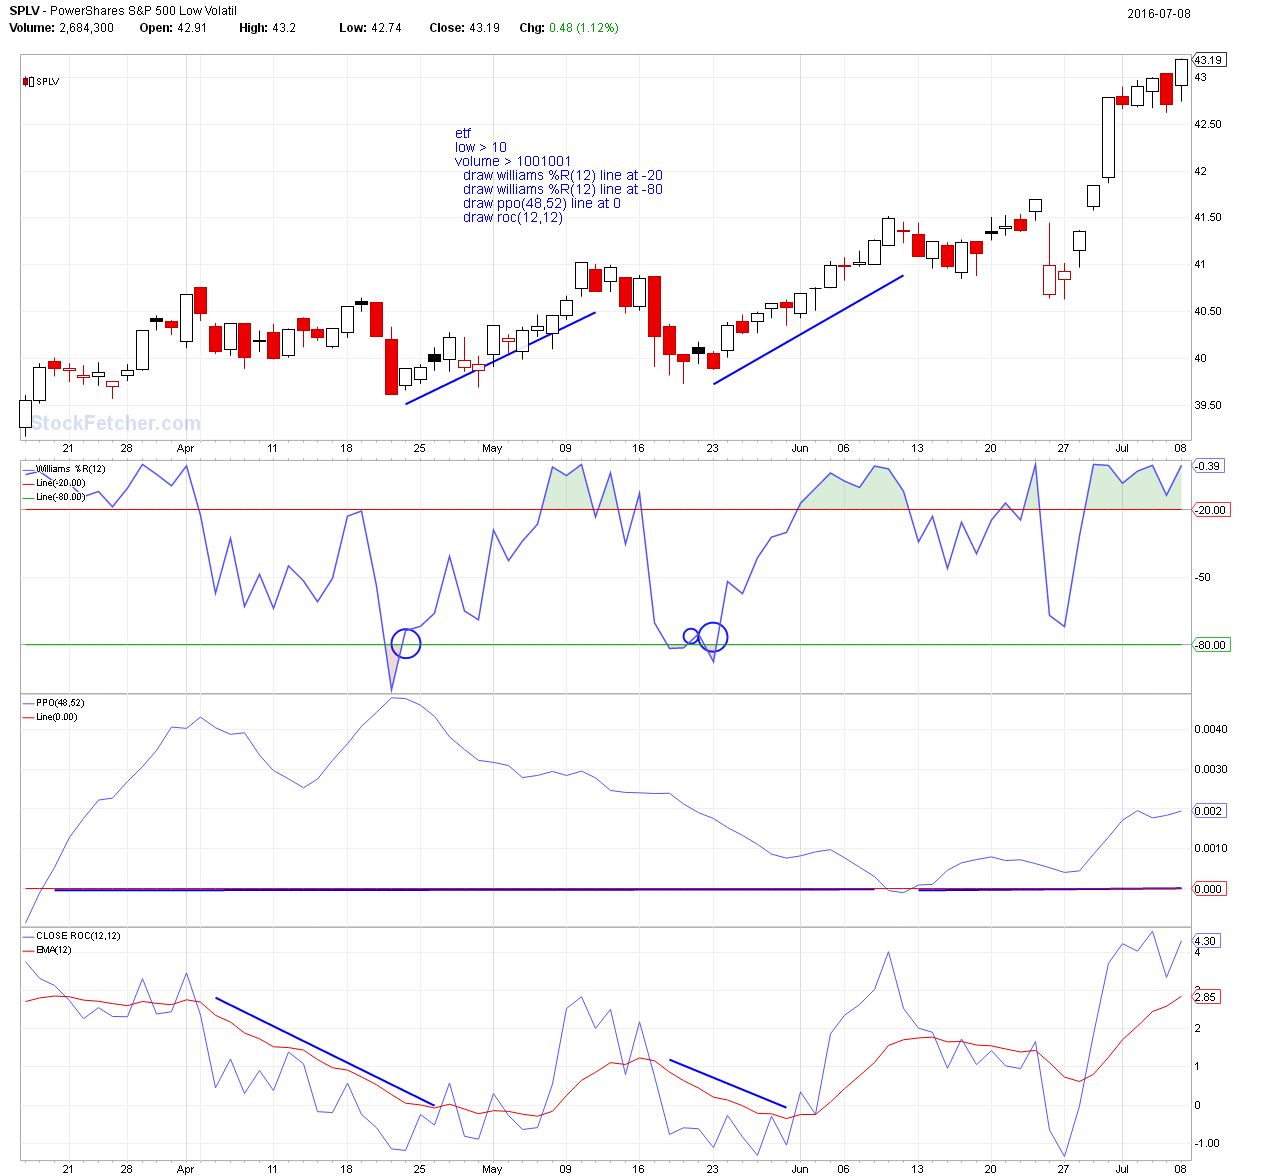 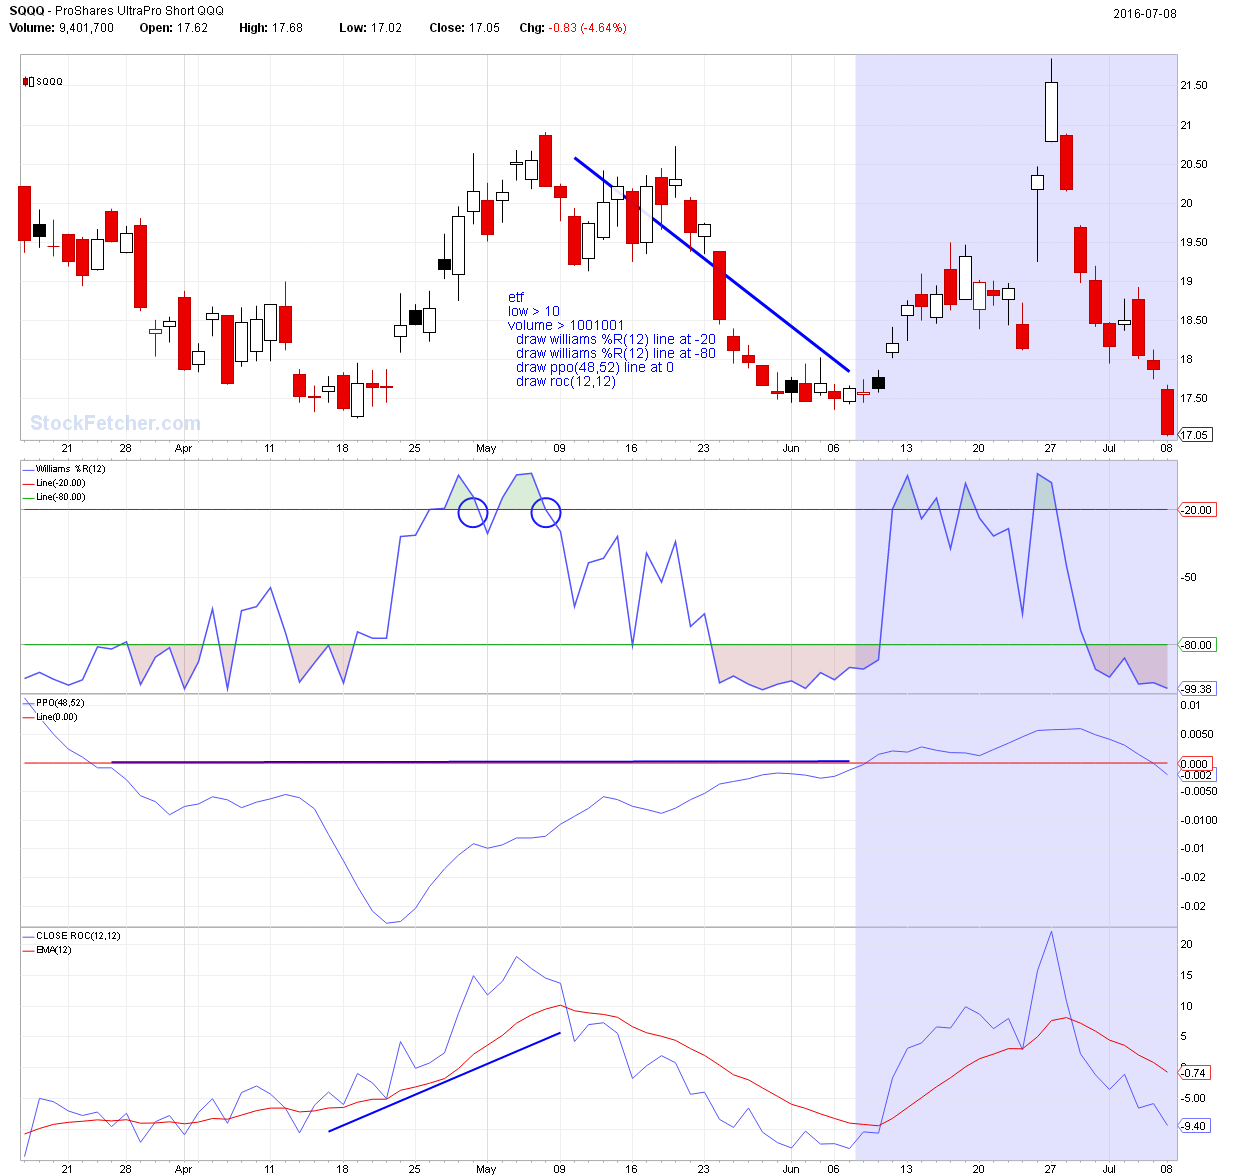 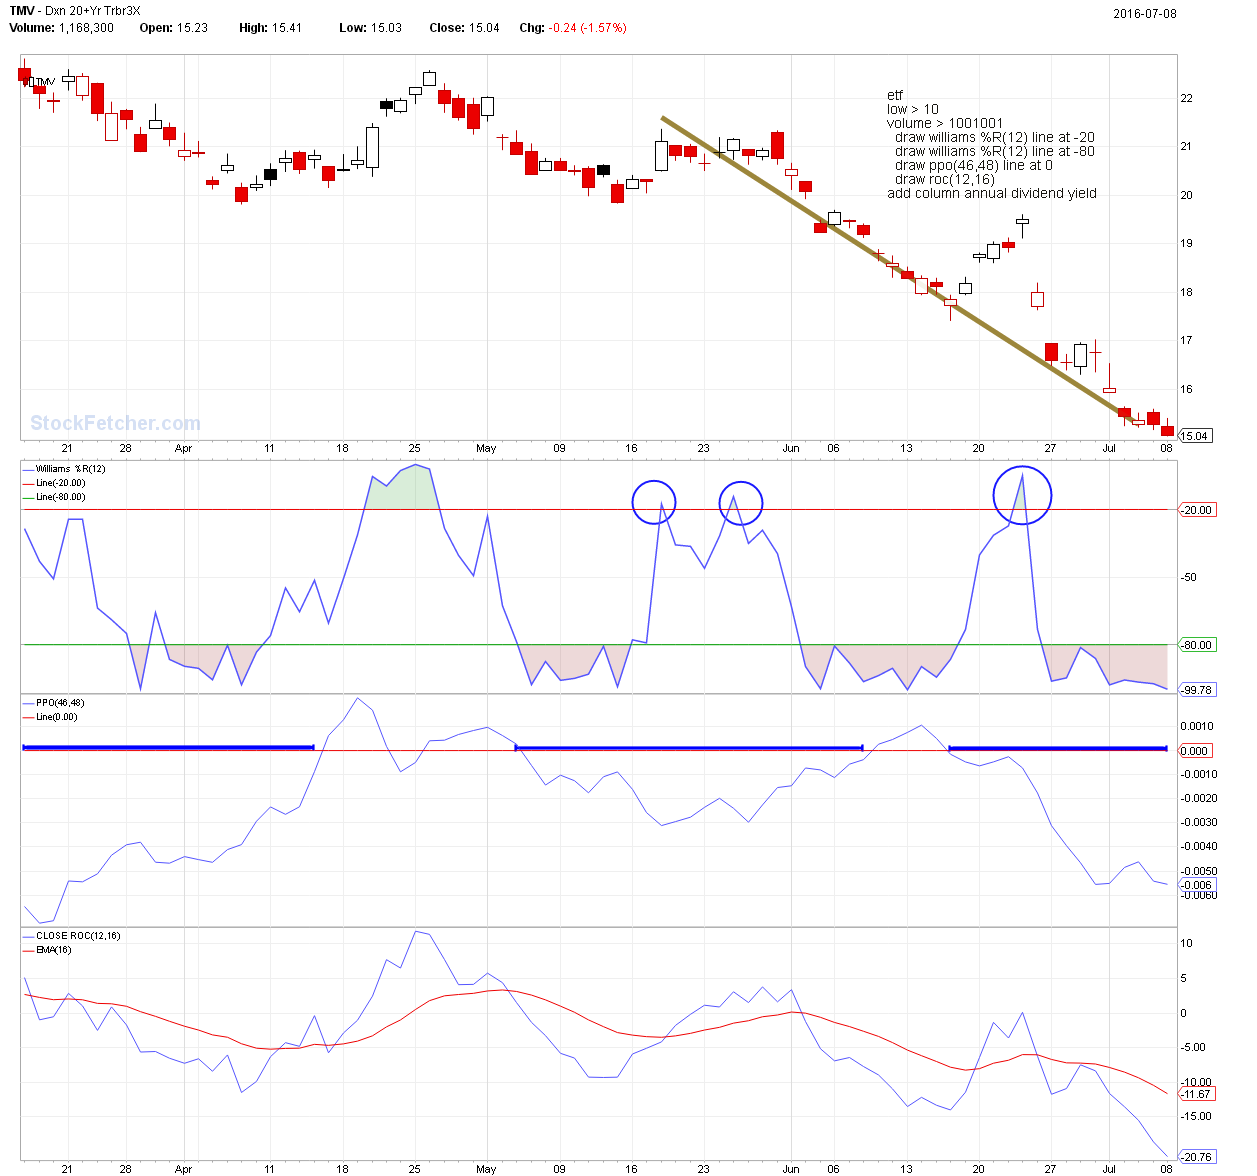 |
| four 5,087 posts msg #129707 - Ignore four |
7/9/2016 11:44:40 PM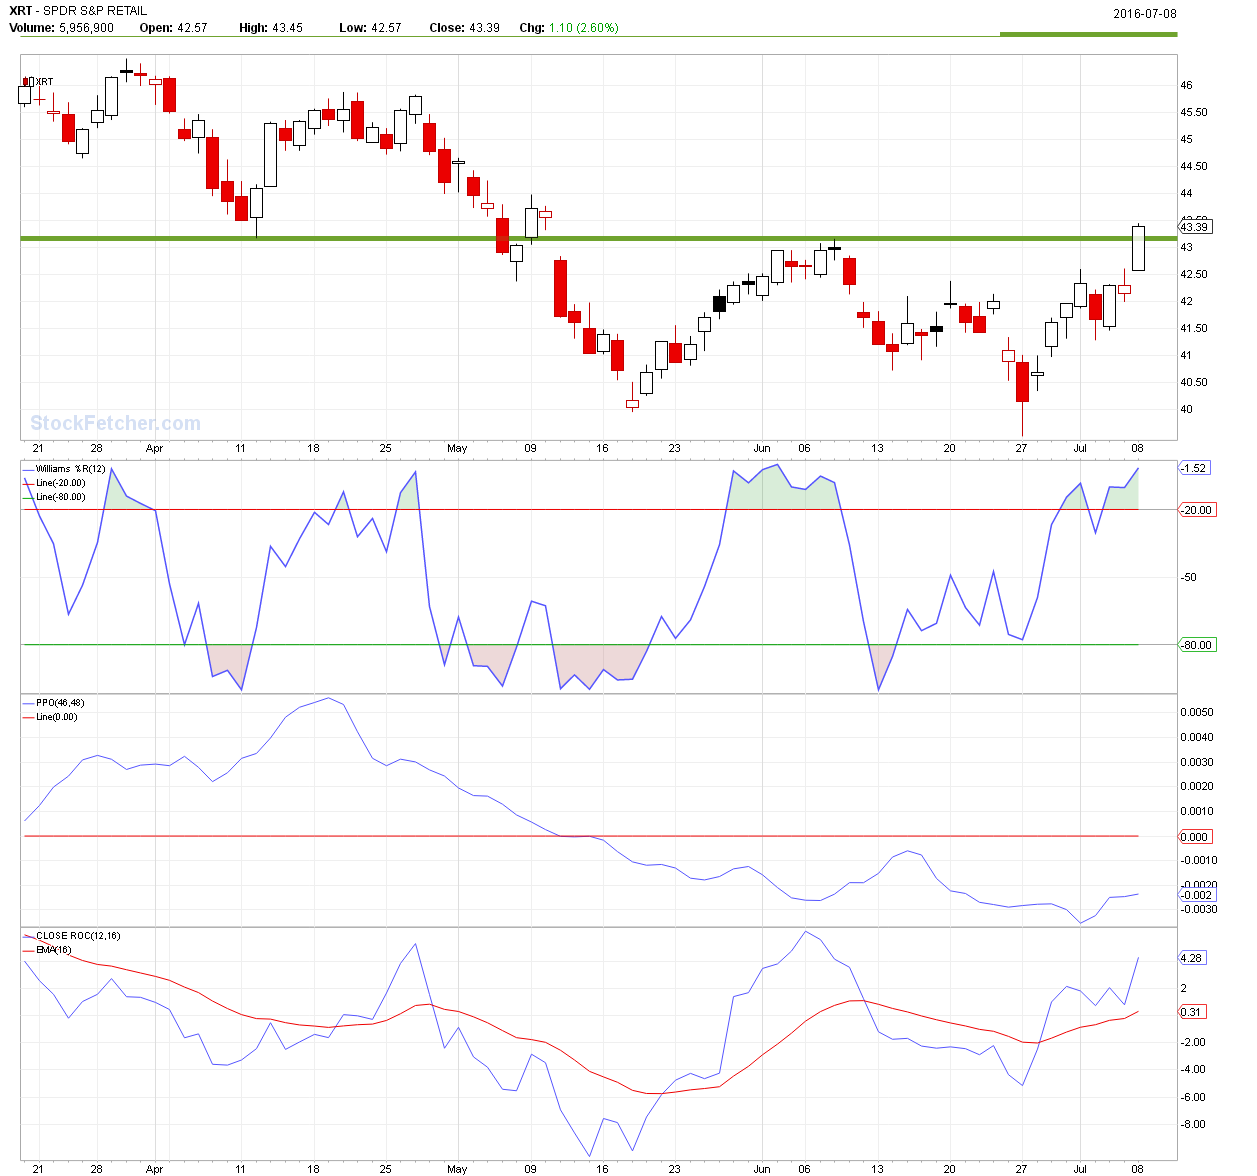 |
| four 5,087 posts msg #129708 - Ignore four modified |
7/10/2016 12:45:03 AM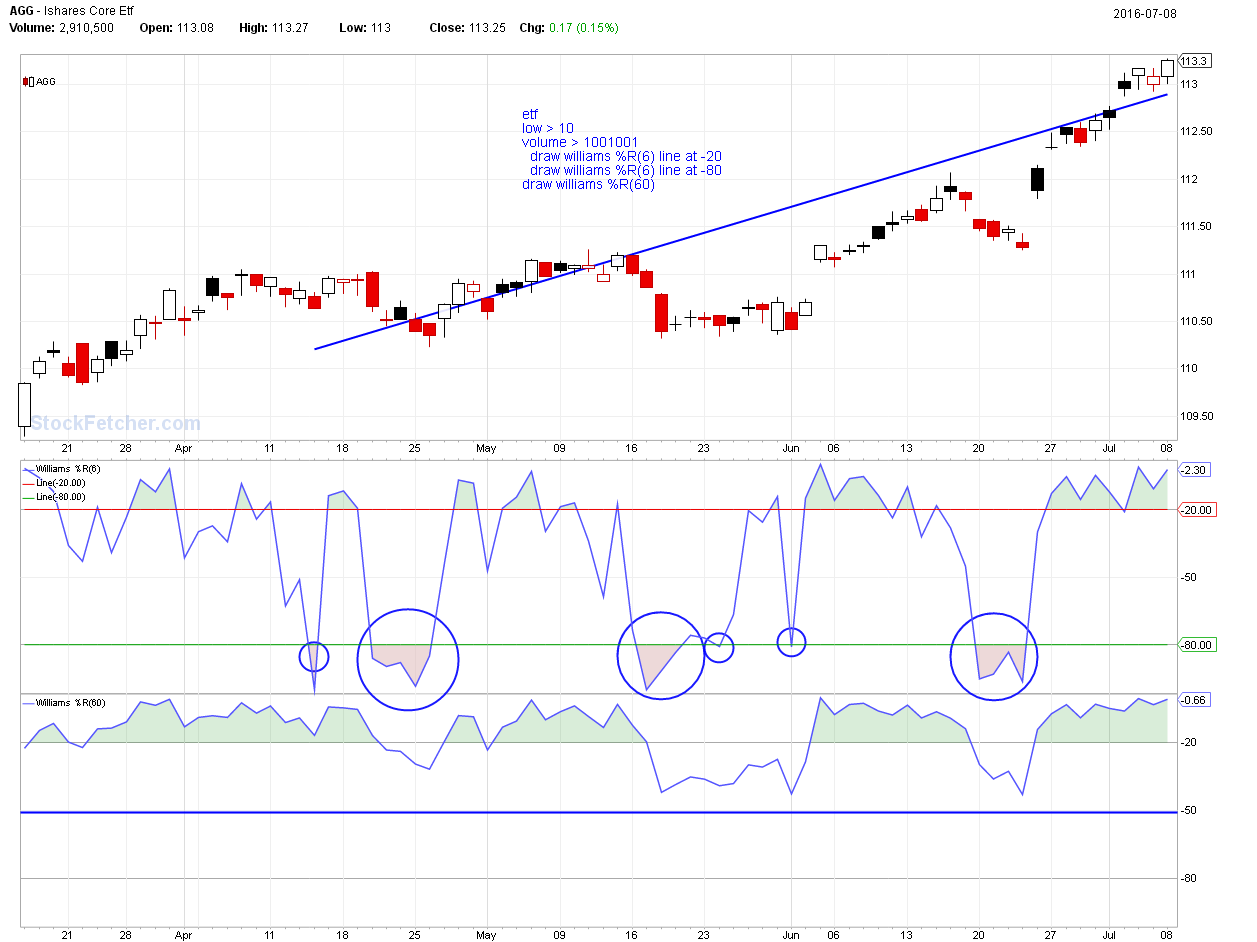 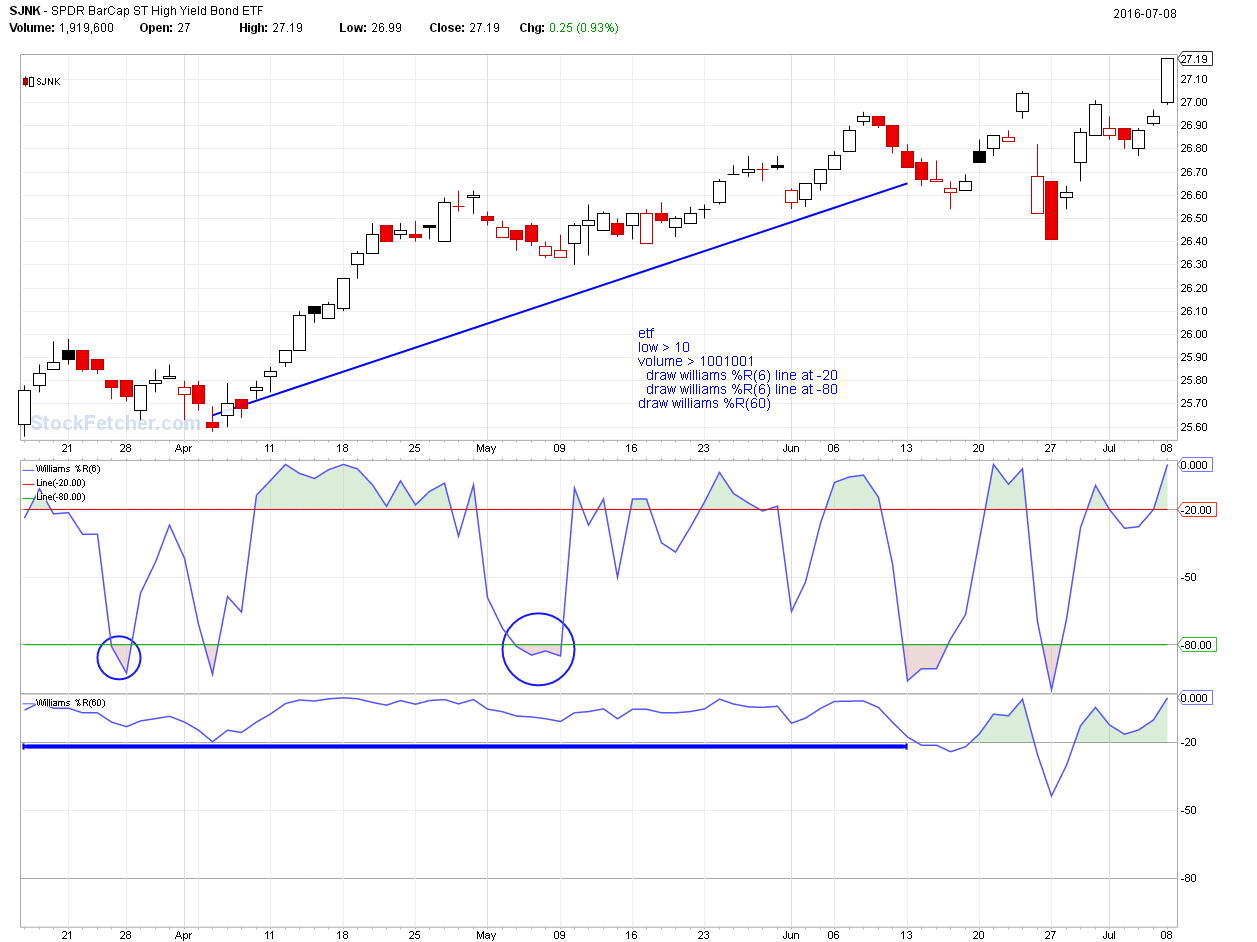 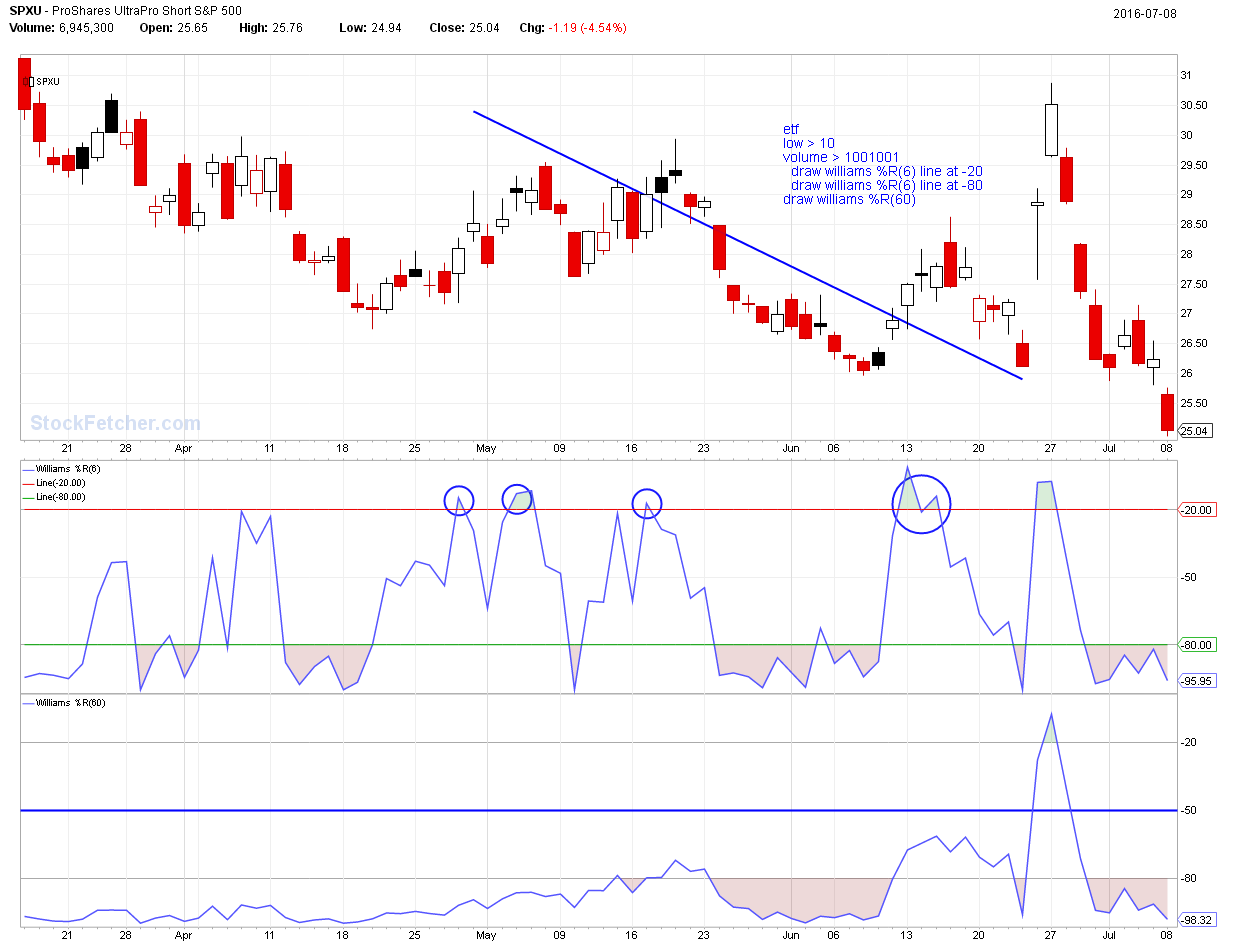 |
| shillllihs 5,974 posts msg #129711 - Ignore shillllihs |
7/10/2016 12:39:44 PM See how nearly every play goes over upper red line. Better with higher volume... |
| StockFetcher Forums · Stock Picks and Trading · Generic | << 1 ... 46 47 48 49 50 ... 63 >>Post Follow-up |