StockFetcher Forums · Stock Picks and Trading · Gold miners<< >>Post Follow-up
djones000buck
206 posts
msg #119916
Ignore djones000buck
5/17/2014 8:27:27 AM

Looking like a good spot to add to positions.. Auy, gdx, hmy, abx.

four
5,087 posts
msg #119972
Ignore four
5/20/2014 2:23:58 PM
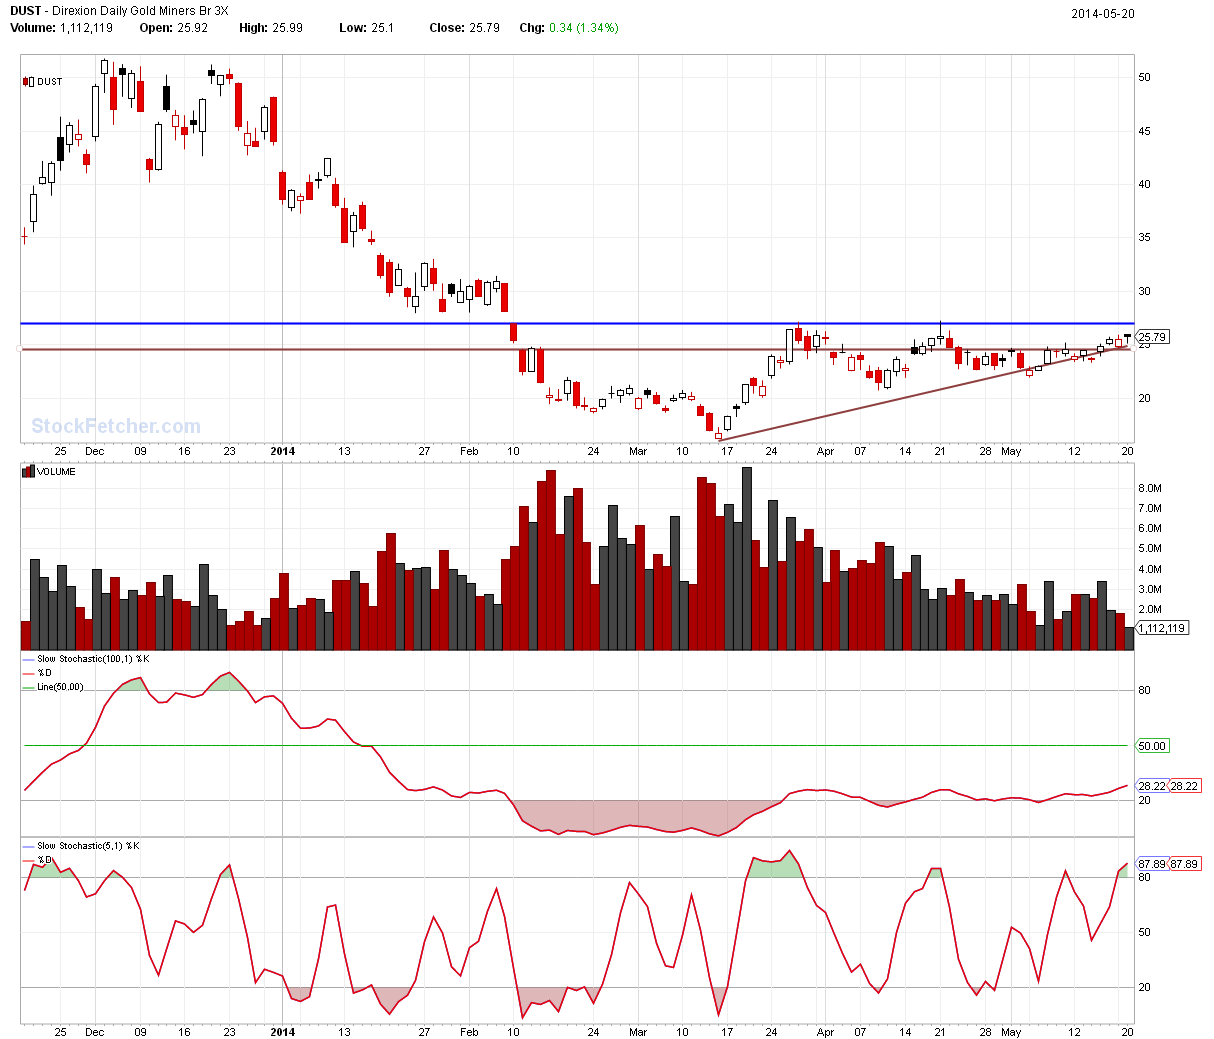


novacane32000
331 posts
msg #119976
Ignore novacane32000
5/20/2014 7:34:51 PM

I have been buying NEM on dips and selling for a quick profit the last 2 or so months. Has worked real well thus far.

djones000buck
206 posts
msg #120378
Ignore djones000buck
6/3/2014 8:54:49 PM

First sign of life showed up gdx,auy,iag...

djones000buck
206 posts
msg #120381
Ignore djones000buck
6/3/2014 10:53:48 PM

Image and video hosting by TinyPic

confirmation tomorrow, maybe Thursday..

djones000buck
206 posts
msg #120382
Ignore djones000buck
modified
6/3/2014 10:54:55 PM

great now have to learn to resize images... it never ends does it :)

notice your "a" code Four, been playing around with it a bit...thx for sharing. i found it confirms and/or beats some of my similar triggers, but only on certain stocks.. I also find my timeframes need to be modified every few weeks or so to adjust to the market..

guspenskiy13
976 posts
msg #120391
Ignore guspenskiy13
modified
6/4/2014 8:59:31 AM

I also noticed that GDX is a buy for today, on multiple screens.... Curious to see the action...

P.S. Could you show the filter that you used in your screenshot? It looks interesting...

Thanks

johnpaulca
12,036 posts
msg #120394
Ignore johnpaulca
6/4/2014 9:14:58 AM

GG($22.82)....this is the most oversold of the bunch

djones000buck
206 posts
msg #120464
Ignore djones000buck
6/4/2014 5:04:03 PM

Sure, tried to clean it up a bit... Busy chart but tried to comment some rationale, I don't display all the trigger events typically, but you get the picture..

Fetcher[

/*Sentiment Display*/
set{redday1, count(open > close,10)}
set{greenday1, count(close > open,10)}

/*Set to 100 scale for use with other indicators*/
set{redday, redday1 * 10}
set{greenday, greenday1 * 10}

/* Add alert */
set{alerta, count(rsi(3) < rsi(14),1)}
set{alertb, count(redday > greenday,1)}
set{alertc, alerta + alertb}
set{alert, count(alertc > 1.9,1)}

/*Waiting for trade to develop, on alert but hold modify this to suit market environment or preference*/
set{holda, count(rsi(3) < rsi(3) one day ago,1)}
set{holdb, holda + alert}
set{hold, count(holdb > 1.9,1)}

/* Add initial buy trigger, end of cycle */
set{1stbuy, count(hold crossed below .9,1)}

/* Add some confirmation and trade management */
set{buymore, count(rsi(3) > redday,1)}
set{reloada, count(buymore 1 day ago < .9,1)}
set{reloadb, count(buymore > .9,1)}
set{reloadc, reloada + reloadb}
set{reload, count(reloadc > 1.9,1)}

/* Draw soome relevant support resistance lines pulled from something FOUR posted, just liked the display */
set{vmax,max(open,close)}
set{vmin,min(open,close)}

/*set high's, this is only done to make the chart legend descriptions shorter and take up less space*/
set{55dayhi, vmax 5 day high 55 days ago}
set{34dayhi, vmax 5 day high 34 days ago}
set{21dayhi, vmax 5 day high 21 days ago}
set{13dayhi, vmax 5 day high 13 days ago}
set{8dayhi, vmax 5 day high 8 days ago}

/*set low's, this is only done to make the chart legend descriptions shorter and take up less space*/
set{55daylo, vmin 5 day low 55 days ago}
set{34daylo, vmin 5 day low 34 days ago}
set{21daylo, vmin 5 day low 21 days ago}
set{13daylo, vmin 5 day low 13 days ago}
set{8daylo, vmin 5 day low 8 days ago}

/*set low alerts based on price touching the vmin lows */
set{alert55, count(price touched 55daylo,1)}
set{alert34, count(price touched 34daylo,1)}
set{alert21, count(price touched 21daylo,1)}
set{alert13, count(price touched 13daylo,1)}
set{alert8, count(price touched 8daylo,1)}

/* sum up the alert triggers */
set{lowalert1, alert55 + alert34}
set{lowalert2, lowalert1 + alert21}
set{lowalert3, lowalert2 + alert13}
set{lowalert4, lowalert3 + alert8}
set{lowalert, count(lowalert4 > .9,1)}


/* add a lower bound display for end of trend and/or stop identification */
Set{lo3, low 3 day low}
Set{lo5, low 5 day low}

/*Another Four display here, again just something to provide a cleaner view, I'll switch between several indicators here */
Set{a,RSI(100)/RSI(10)}
Set{b,count(a crossed below 1,1)}
set{c, INDPOSITION(a, 100) }
set{swing, c * 100}

/*Another visual added for reference deep in cycle other indicators and/or price levels should have you exiting and/or taking profit */
set{youshouldhavesoldalready, count(buymore crossed below .9,1)}

/*draw chart lines*/
draw price line at 55daylo
draw price line at 34daylo
draw price line at 21daylo
draw price line at 13daylo
draw price line at 8daylo
Draw lo3 on plot price
Draw lo5 on plot price

/*Draw Trigger events*/
draw alert
draw hold
draw 1stbuy
draw reload
draw buymore
draw youshouldhavesoldalready

/*Draw custom sentiment display*/
Draw greenday
Draw redday on plot greenday
Draw RSI(14) on plot greenday
Draw RSI(3) on plot greenday

/*Draw additional indicators/meansures here*/
and draw swing
and draw rsi(15) on plot swing

/*add some columns for sorting*/
add column redday
add column lowalert
add column 1stbuy
add column reload
Add column greenday

/*Add price and volume criteria */
price between 2 and 50
volume above 1000000

And draw b
Sort column 7 descending

]


guspenskiy13
976 posts
msg #120466
Ignore guspenskiy13
6/4/2014 6:15:03 PM

Thanks for posting, I appreciate it.

StockFetcher Forums · Stock Picks and Trading · Gold miners<< >>Post Follow-up

*** Disclaimer *** StockFetcher.com does not endorse or suggest any of the securities which are returned in any of the searches or filters. They are provided purely for informational and research purposes. StockFetcher.com does not recommend particular securities. StockFetcher.com, Vestyl Software, L.L.C. and involved content providers shall not be liable for any errors or delays in the content, or for any actions taken based on the content.


Copyright 2022 - Vestyl Software L.L.C.Terms of Service | License | Questions or comments? Contact Us
EOD Data sources: DDFPlus & CSI Data Quotes delayed during active market hours. Delay times are at least 15 mins for NASDAQ, 20 mins for NYSE and Amex. Delayed intraday data provided by DDFPlus


This site is protected by reCAPTCHA and the Google Privacy Policy and Terms of Service apply.