| StockFetcher Forums · Filter Exchange · FILTER BASED ON MOVING AVERAGES OF PIVOTS | << 1 2 >>Post Follow-up |
| TheRumpledOne 6,407 posts msg #98200 - Ignore TheRumpledOne |
12/25/2010 11:46:04 AM "I get a message "Your StockFetcher filter exceeds filter performance restrictions"" You need the ADVANCED SF SUBSCRIPTION. |
| Kevin_in_GA 4,599 posts msg #98203 - Ignore Kevin_in_GA |
12/25/2010 2:00:58 PM Try this instead: The restriction comes from your wanting to plot all three signals on the same chart. Just plot them on different panels and you are fine. You need to also pick either a set of stocks or a set of filter conditions as well. As currently written, this is only an indicator and not a selection process just yet. Kevin |
| bkhurana43 103 posts msg #98207 - Ignore bkhurana43 |
12/25/2010 3:59:09 PM Thanks Keven, I am thinking of using this filter for my option trading. I will use a watchlist upfront. The sample would be as follows: However the list is still too long. Can you suggest an improvement? I heard MTC CHECKER filter with a banner like YOU NEVER LOSE AGAIN is the best for this purpose. I would love to have the link to the real MTC CHECKER to study. Further is there anyway to chose the colour of your choice to draw WAIT, BUY or SELL plots? Bob |
| Kevin_in_GA 4,599 posts msg #98208 - Ignore Kevin_in_GA |
12/25/2010 5:11:40 PM This only pulls up BUY sugnals that were generated today: Note also that I added a column for atr(14), then sorted the list by this indicator. Now the highest ATR(14) stocks are listed first. That may help you focus on only those with a high volatility. Kevin |
| bkhurana43 103 posts msg #98233 - Ignore bkhurana43 |
12/27/2010 12:24:40 PM Hi, Messege addressed to TheRumpledOne! Please provide me links for your famous SF filters (Final versions) called "MTC Checker", "NEVER LOSE AGAIN" if possible. I am new to SF and want to learn more from experienced and well versed people like you. I am getting into Options Trading using TOS and TWS (IB) platforms thus any further suggestions from your end with regard to Options Scanners and reading any other relevant material etc. would be highly appreciated. Regards, Bob |
| mystiq 650 posts msg #98335 - Ignore mystiq modified |
12/31/2010 2:32:22 AM /* modified to use 9ema PP / WAIT column represent a trade oppurtunity */ /* indicator use only */ |
| big257357457gunn 1 posts msg #125634 - Ignore big257357457gunn |
10/17/2015 7:38:24 AM How would you make a filter that show the price opening on EMA(10) I have tried and could not do it. If it is possible to do, would you please send info to johnatpall@yahoo.com thanks for the help. Sign John |
| Mactheriverrat 3,135 posts msg #125635 - Ignore Mactheriverrat modified |
10/17/2015 2:12:46 PM Sort column's by the buy column TWTR = at resistance line , median bollinger band(20,2) line which is really MA(20) is trending up, median bollinger band(20,2) expanding and looking good for a run next week using this filter system- I'm sure it come's up on other filter systems also. 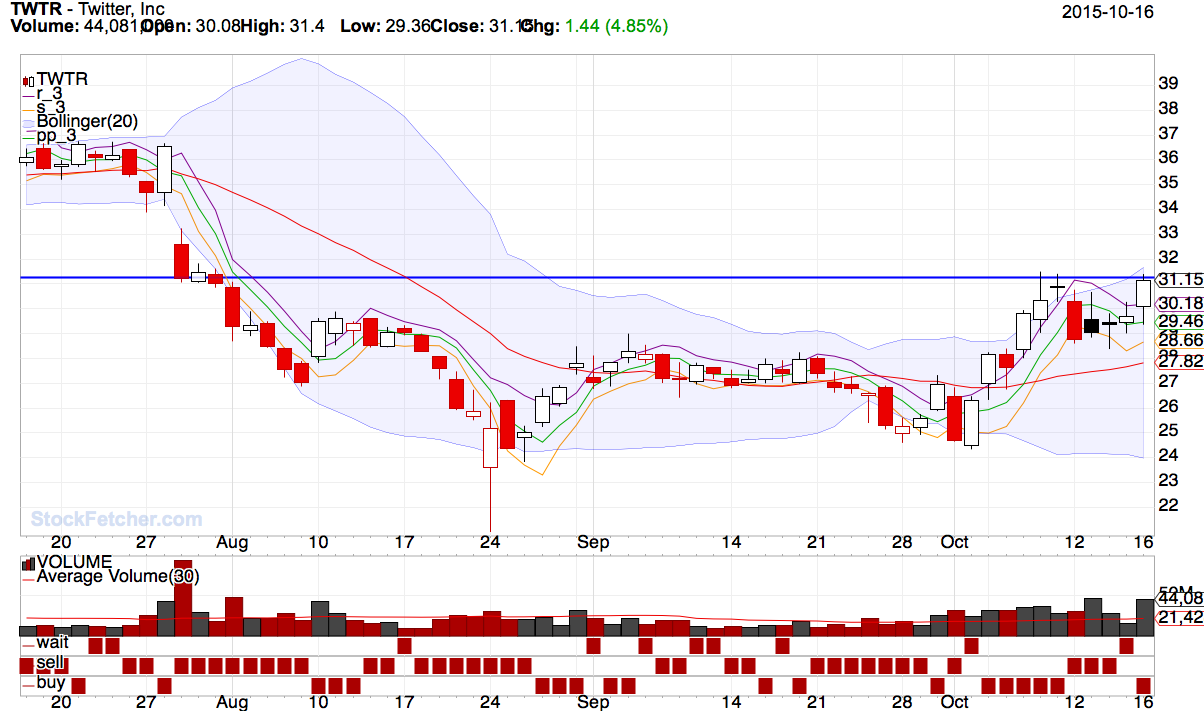 ----------------------------- Not sure on the 10 day thing- maybe some of the older poster's here can come up with the code for it. |
| Mactheriverrat 3,135 posts msg #125740 - Ignore Mactheriverrat |
10/22/2015 3:50:25 PM I use average day range(30) is above 4.50 rather than Average true range. and market is not OTCBB Market is not ETF Take's out a lot of worthless junk out of filters - IMHO |
| StockFetcher Forums · Filter Exchange · FILTER BASED ON MOVING AVERAGES OF PIVOTS | << 1 2 >>Post Follow-up |