StockFetcher Forums · Filter Exchange · Moving Average of Moving Average<< >>Post Follow-up
bconnell
3 posts
msg #158979
Ignore bconnell
4/16/2022 7:13:56 PM

I've been playing around and discovered that by using a moving average of a moving average I've been able to pinpoint great entries and exits. This filter uses the cma(ema(5,6)) but you can use any time lengths you want, I've found this to be the simplest as it doesn't produce a lot of false hits. My backtesting shows using the cma(ema(4,3)) is the most profitable but has too many hits for my liking.

I swing trade options and usually in/out from 1 day to 2 weeks. I'm looking to see if anyone has better backtesting software and can help validate my findings.

Here is the filter I use (using DOW 30 but obviously you can any watchlist you want). This filter returns all stocks in the Dow 30 but using EMA56 column for a 1 (new long position) or a -1 (new short position). I use most of the other columns for earlier entries and exits and would be happy to discuss if anyone is interested.

Any improvements that help improve this filter will be greatly appreciated

Fetcher[index is dow 30
chart-time is 6 months

/*index is s&p 100*/
/*index is nasdaq 100*/
/*index is Rusell 1000*/

set {ccisell, count (cci(3) > 99,1)}
draw ccisell
set {rsiHsell, count(rsi(2) > 95,1)}
draw rsiHsell
set {rsisell, count(rsi(2) > 80,1)}
draw rsisell
set {wrsell, count(williams %r(2) > -20,1)}
draw wrsell

set {Space1, count (CCI(30) > 300, 1)}
draw Space1

Set{EMA56LONG,count( ema(5) > cma(ema(5),6) ,1)}
draw EMA56LONG

Set{EMA56SHORT,count( ema(5) < cma(ema(5),6) ,1)}
draw EMA56SHORT

set{Space4, count (cci(14) > 300, 1)}
draw Space4

set {cntCCI14200, count (cci(14) > 200, 1)}
draw cntCCI14200

set {CCI14EXIT, count (cci(14) > 100, 1)}
draw CCI14EXIT

set {cntCCI14, count (cci(14) > 0, 1)}
draw cntCCI14

set {cntCCI14-100, count (cci(14) > -100, 1)}
draw cntCCI14-100

set {Space5, count (cci(30) > 300, 1)}
draw Space5

set {cntCCI30200, count (cci(30) > 200, 1)}
draw cntCCI30200

set {CCI30EXIT, count (cci(30) > 100, 1)}
draw CCI30EXIT

set {cntCCI30, count (cci(30) > 0, 1)}
draw cntCCI30

set {cntCCI30-100, count (cci(30) > -100, 1)}
draw cntCCI30-100

set {Space5x, count (cci(30) > 300, 1)}
draw Space5x

set {cciLbuy, count (cci(3) < -90,1)}
draw cciLbuy
set {rsibuy, count(rsi(2) < 20,1)}
draw rsibuy
set {rsiLbuy, count(rsi(2) < 5,1)}
draw rsiLbuy
set {wrbuy, count(williams %r(2) < -80,1)}
draw wrbuy

draw CCI(30) line at 100
draw CCI(30) line at -100
draw CCI(30) line at 200
draw CCI(30) line at -200
draw CCI(30) line at 0

draw cci(14) line at 0
draw cci(14) line at 100
draw cci(14) line at -100

draw CCI(3) line at -70
draw CCI(3) line at 70

draw rsi(2) line at 85
draw rsi(2) line at 15
draw rsi(2) line at 95
draw rsi(2) line at 5

draw williams %r(2)

add column separator
]


xarlor
561 posts
msg #158980
Ignore xarlor
modified
4/16/2022 9:08:47 PM

Welcome to the StockFetcher community, bconnell!

Very interesting results on the ema(5), cma(ema(5),6) crossover. I've made some additions/changes based on my trading style.

  • I took out all the noise as I prefer my charts a bit cleaner. Completely personal preference here.
  • To catch the start of the run, I only display tickers who just performed the crossover.
  • I noticed these tend to run a lot longer if they are already in an uptrend (defined by me as close above wma(150)). It still works if the stock is in a downtrend, but the runs are short; a lot of times very short and not worth it to me.
  • I sorted the results by those in an uptrend first. Depending on how that goes, I may just remove the downtrend ones and only display the uptrends. Starting out, I want to see the performance of both trends.
Again, kudos to finding this pattern and an even bigger thank you for sharing. Looking quite promising.

Fetcher[
index is dow 30

Set{EMA56LONG,count( ema(5) > cma(ema(5),6) ,1)}
draw EMA56LONG

Set{EMA56SHORT,count( ema(5) < cma(ema(5),6) ,1)}
draw EMA56SHORT

ema56long > 0
ema56long 1 day ago equals 0

set{Uptrend,count(close > wma(150),1)}
set{Downtrend,count(close < wma(150),1)}
add column Uptrend
add column Downtrend
sort column 5 descending

draw ema(5)
draw cma(ema(5),6)
draw wma(150)
]


snappyfrog
651 posts
msg #158981
Ignore snappyfrog
4/17/2022 1:50:03 AM

Basically the same as the close crossing above the EMA(9). Not taking
away anything from your writing abilities, but I try to look at the most
simplest for scanning.

Taking out the sell line from xalor's, I can compare the buy signals
from the double moving average and the close crossing above the
EMA(9).
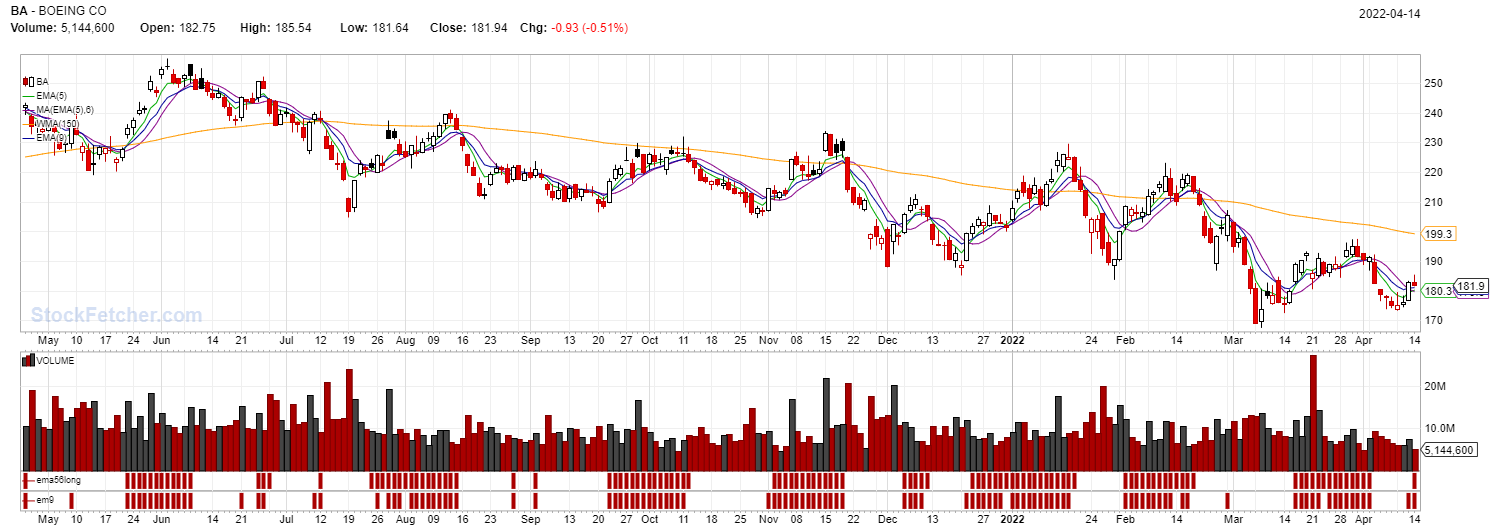


Fetcher[
index is dow 30

Set{EMA56LONG,count( ema(5) > cma(ema(5),6) ,1)}
draw EMA56LONG

ema56long > 0
ema56long 1 day ago equals 0

set{Uptrend,count(close > wma(150),1)}
set{Downtrend,count(close < wma(150),1)}
add column Uptrend
add column Downtrend
sort column 5 descending

draw ema(5)
draw cma(ema(5),6)
draw wma(150)
draw ema(9)
set{em9, count (close > ema(9),1)}
draw em9
]


bconnell
3 posts
msg #158982
Ignore bconnell
4/17/2022 11:45:38 AM

Thank you Xarlor and SnappyFrog for the feedback, very much appreciated. I've played around with longer moving averages (for example cma(ema(5,10)) and that seems to weed out some of the false hits. Using a longer MA as Xarlor recommended as a guide is helpful and should keep you trading in the right direction.

As far as only using a single moving average, I haven't had much luck finding the right number as many of them have a lot of false hits. EMA(9) looks very promising - thanks again SnappyFrog, I'll continue to look at this.

I'm only trading about 5 stocks (buying / selling options) and play both directions so looking for the most accurate entries/exits as possible - same as everyone else here I assume.


dtatu
143 posts
msg #159010
Ignore dtatu
4/27/2022 5:59:22 AM

I thought this was basically G.Aple’s 1970 MACD indicator, or am I wrong?
https://en.wikipedia.org/wiki/MACD

StockFetcher Forums · Filter Exchange · Moving Average of Moving Average<< >>Post Follow-up

*** Disclaimer *** StockFetcher.com does not endorse or suggest any of the securities which are returned in any of the searches or filters. They are provided purely for informational and research purposes. StockFetcher.com does not recommend particular securities. StockFetcher.com, Vestyl Software, L.L.C. and involved content providers shall not be liable for any errors or delays in the content, or for any actions taken based on the content.


Copyright 2022 - Vestyl Software L.L.C.Terms of Service | License | Questions or comments? Contact Us
EOD Data sources: DDFPlus & CSI Data Quotes delayed during active market hours. Delay times are at least 15 mins for NASDAQ, 20 mins for NYSE and Amex. Delayed intraday data provided by DDFPlus


This site is protected by reCAPTCHA and the Google Privacy Policy and Terms of Service apply.