| StockFetcher Forums · Filter Exchange · use of the | << >>Post Follow-up |
| springhill 74 posts msg #121594 - Ignore springhill modified |
9/27/2014 6:03:37 PM Use of the "days" function, I am trying to use the "days" function to find how many days have passed since price was below today's low. Here is the filter I am trying to use. All I get is -1 for a var1 value. Is it possible for SF to even do this ? Thanks for any help price is above 25 average volume (50) above 800000 atr(14) is above 1 do not draw atr(14) low is at 5 day low set {var1, days (close below todays low, 100)} add column var1 draw price line at todays low |
| four 5,087 posts msg #121595 - Ignore four modified |
9/27/2014 7:39:56 PM I am trying to use the "days" function to find how many days have passed since price was below today's low. Here is the filter I am trying to use. All I get is -1 for a var1 value. The -1 means that VAR1 did not occur = close today can not be below the low today - - - - - - Does this model help... /* AS OF Sept 26, 2014 and looking at 10 days value of '-1' = close TODAY ABOVE ma(100) = ACE value of '0' = close TODAY BELOW ma(100) = FLR value of greater than '0' = var1 occurred # of days ago = CLX NOTE: above -1 means that var1 occurred */ |
| four 5,087 posts msg #121596 - Ignore four modified |
9/27/2014 7:49:26 PM |
| springhill 74 posts msg #121597 - Ignore springhill |
9/27/2014 10:45:09 PM Hi four, thanks for the input. However, I am not looking for stocks involved with the 100 day moving average. I am just trying to determine how many days have passed since price contacted the current day's low in some way. the 100 in the syntax is the number of days I asked SF to look back for that involvement. Looks like it is too much to ask SF filter logic to process Thanks again for giving it a shot. |
| four 5,087 posts msg #121600 - Ignore four modified |
9/27/2014 11:13:43 PM |
| springhill 74 posts msg #121608 - Ignore springhill modified |
9/28/2014 7:10:46 PM Hello four, good sunday afternoon to you Thank you for trying again. I found I could create a link to an SF chart to show what I'm trying to accomplish 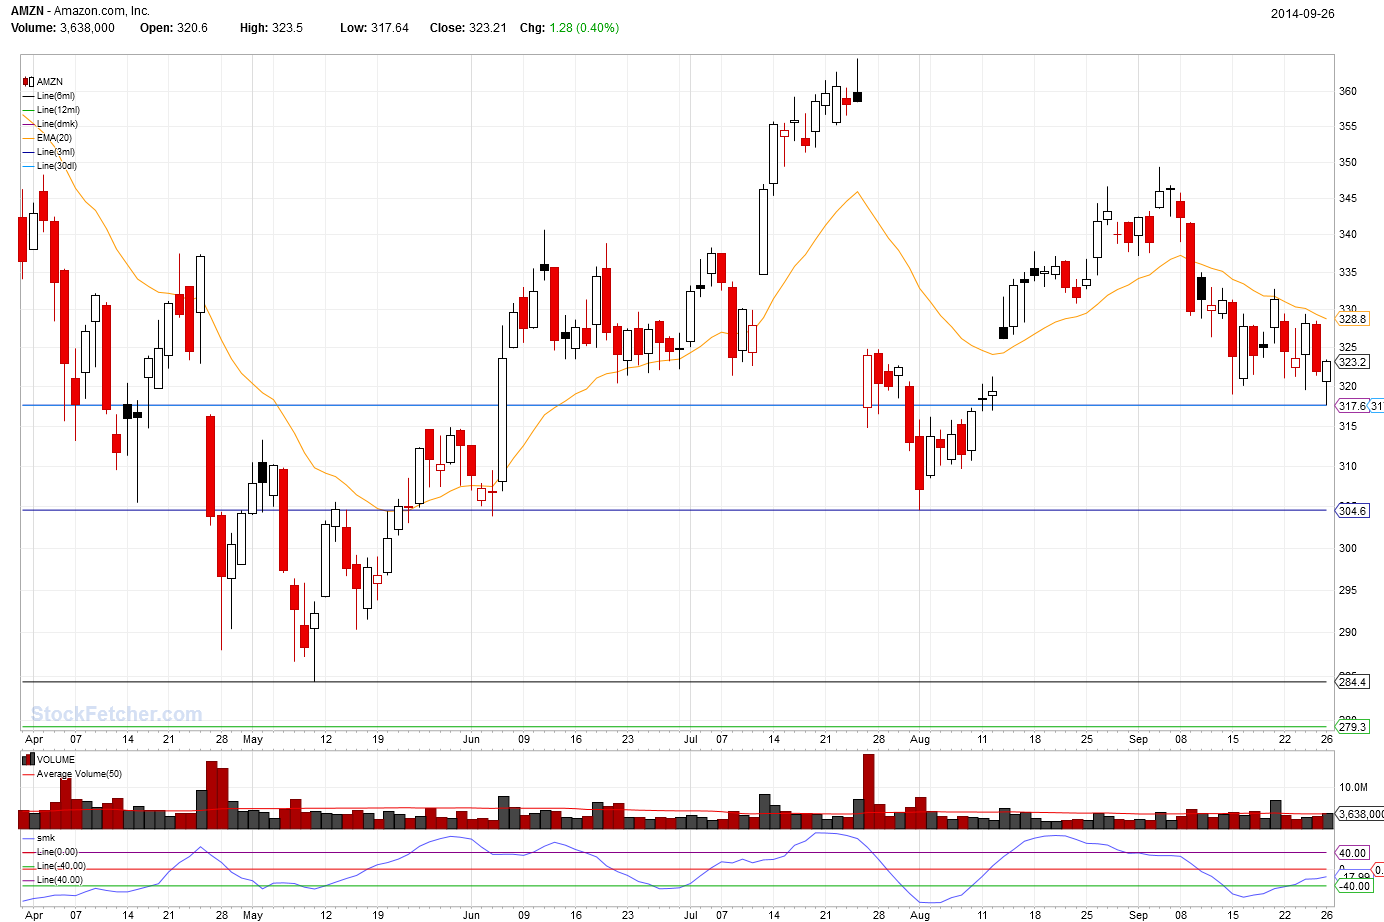 I want the filter to show how many days it is from 9/26/14 back to 8/12/14. That was the day the price of AMZN was at the same price level. Any other ideas for counting those days? |
| StockFetcher Forums · Filter Exchange · use of the | << >>Post Follow-up |