| StockFetcher Forums · General Discussion · A look at the $SPX - MA 50 , MA200 | << 1 2 3 >>Post Follow-up |
| Mactheriverrat 3,136 posts msg #160532 - Ignore Mactheriverrat |
8/27/2023 9:45:05 PM SPY is off lows. RSI 14 shows it. Need to break downtrend line to go back Bullish. 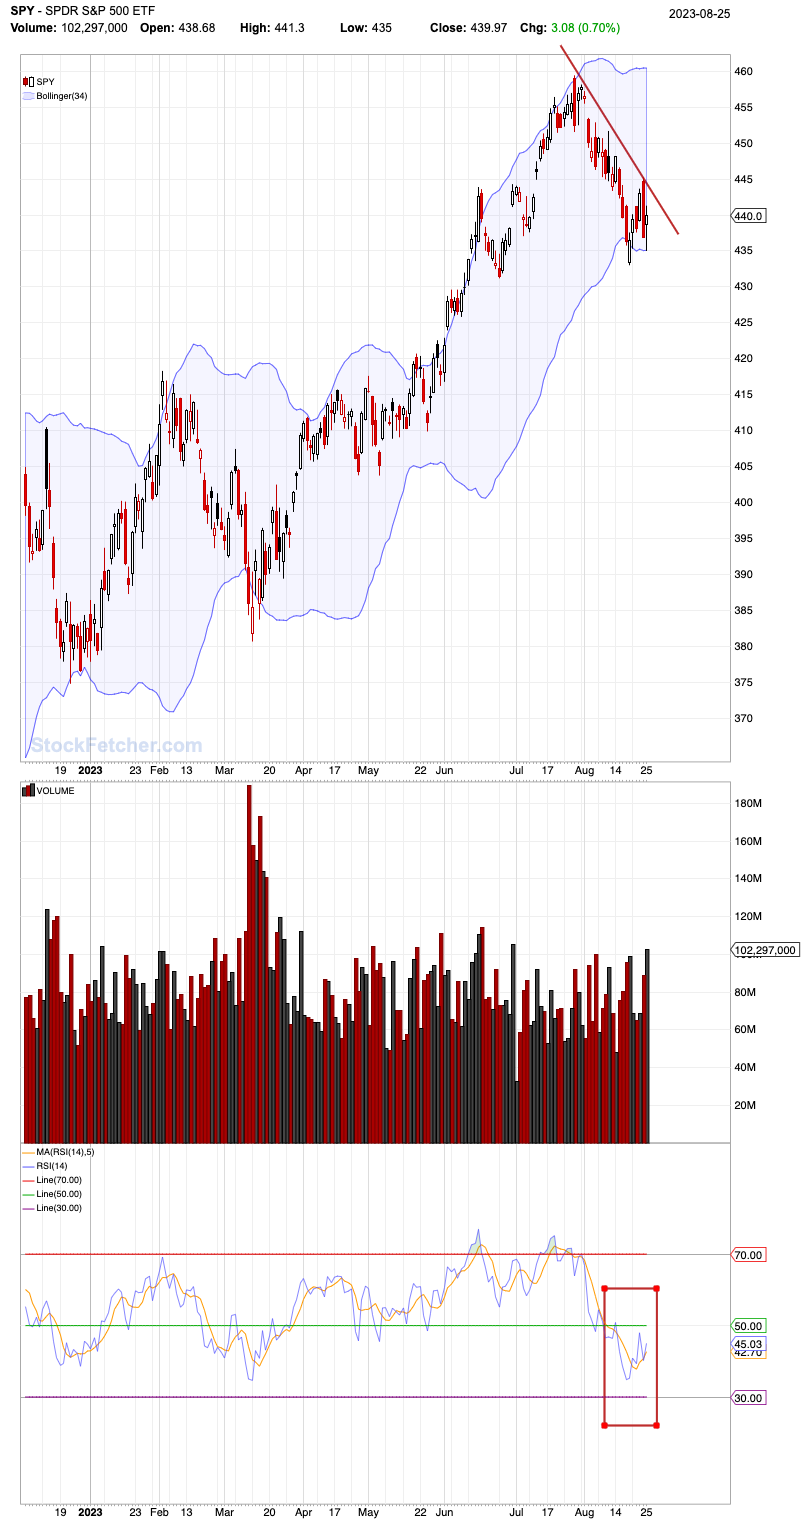 |
| Mactheriverrat 3,136 posts msg #160534 - Ignore Mactheriverrat modified |
8/29/2023 9:48:42 PM SPY - Nice Bullish candle today. RSI(14) above 50 line considered Bullish. 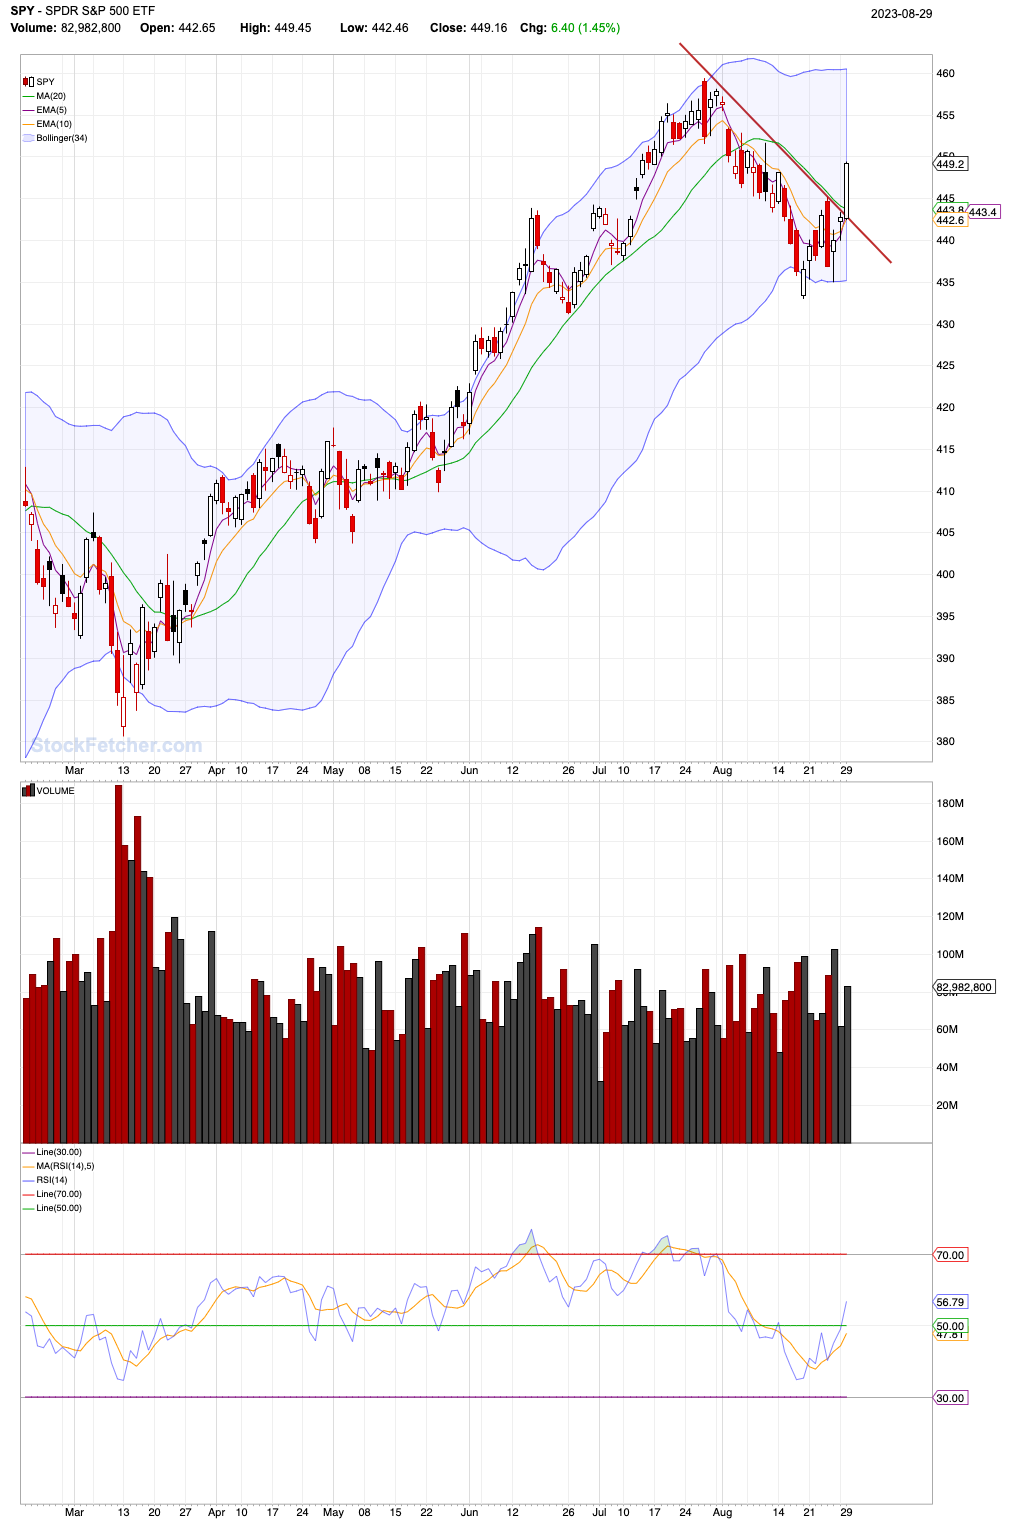 |
| lemmy 12 posts msg #160537 - Ignore lemmy |
9/4/2023 12:34:04 PM I seem to be noticing some stocks (CSCO is one) that are up several days in a row and with some, arguably, topping tails. You never know in this market, but it sure looks like a pullback might be in order. And the US Government's fiscal year ends on 9/30/2023. Are we going to have some more budget or "fiscal cliff" shenanigans? That's usually not good for the market. |
| sr7 103 posts msg #160559 - Ignore sr7 |
9/18/2023 11:27:12 PM You see that blue line going sideways? That's the Kaufman's Moving Average; I forgot to mention that it's got fractals and other powerful stuff built into it. Anyway, it's going sideways, this means that the S&P 500 is going sideways too. There's no bullish trend; no bearish trend --- for now, it's just going sideways (consolidating).  |
| snappyfrog 656 posts msg #160560 - Ignore snappyfrog |
9/19/2023 8:55:13 AM Don't think I've seen Kaufman Moving Average mentioned in SF. |
| Mactheriverrat 3,136 posts msg #160561 - Ignore Mactheriverrat |
9/19/2023 11:33:35 AM Could you post the code for that Kaufman's Moving Average? |
| jimvin 170 posts msg #160563 - Ignore jimvin |
9/19/2023 8:14:08 PM For what it's worth... Quick introduction to the material and formulas available here: https://school.stockcharts.com/doku.php?id=technical_indicators:kaufman_s_adaptive_moving_average jm.v. |
| Mactheriverrat 3,136 posts msg #160573 - Ignore Mactheriverrat |
9/21/2023 10:47:19 PM As far as SPY is concerned is either were at somewhere of support or more blood in the streets. Stupid Government can't get it's act together on funding so we go towards the brink of a shutdown. IMHO. |
| sr7 103 posts msg #160574 - Ignore sr7 |
9/21/2023 11:18:27 PM That's it, a bearish trend is forming and the S&P is dropping like a rock. If I'm right, it's forming the right shoulder. So I went online to see what to do next and apparently, we're suppose to draw a line across the neck-line of the pattern --- and if the price crosses below the neckline, the downward trend continues.  |
| Mactheriverrat 3,136 posts msg #160575 - Ignore Mactheriverrat |
9/22/2023 12:20:36 AM 4200 next support area |
| StockFetcher Forums · General Discussion · A look at the $SPX - MA 50 , MA200 | << 1 2 3 >>Post Follow-up |