StockFetcher Forums · General Discussion · Best Search Setup for Finding Ranges<< >>Post Follow-up
ibankcoin
24 posts
msg #128453
Ignore ibankcoin
5/14/2016 2:31:24 PM

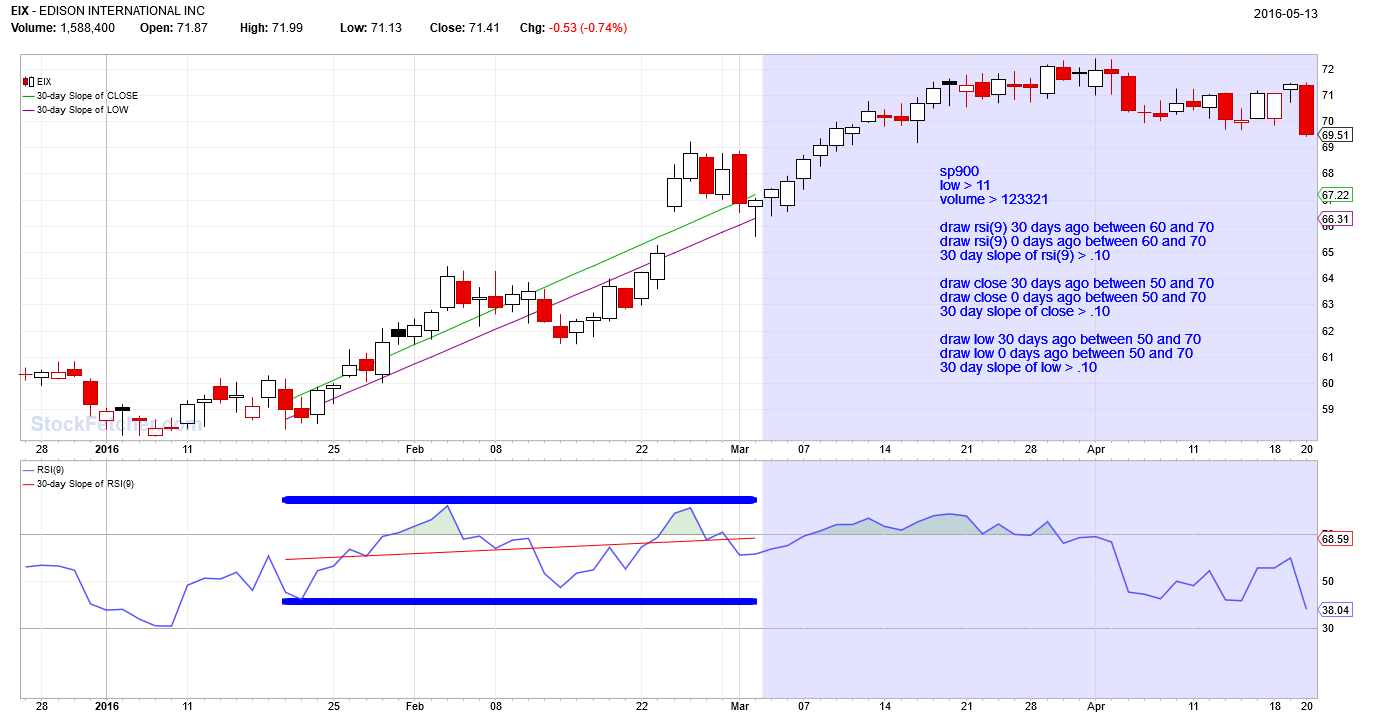
I've tried different indicators before to try and identify some ongoing ranges, but I'm not real happy with the results. Does anyone have a good combination or singular indicator(s) that does a good job of locating trading ranges of say, at least 6-8 weeks. Appreciate any feedback.

four
5,087 posts
msg #128458
Ignore four
modified
5/14/2016 8:33:54 PM

perhaps...


Fetcher[
sp900
low > 11
volume > 123321

draw rsi(9) 30 days ago between 60 and 70
draw rsi(9) 0 days ago between 60 and 70
30 day slope of rsi(9) > .10

draw close 30 days ago between 50 and 70
draw close 0 days ago between 50 and 70
30 day slope of close > .10

draw low 30 days ago between 50 and 70
draw low 0 days ago between 50 and 70
30 day slope of low > .10
]


Mactheriverrat
3,135 posts
msg #128462
Ignore Mactheriverrat
modified
5/15/2016 12:21:11 AM

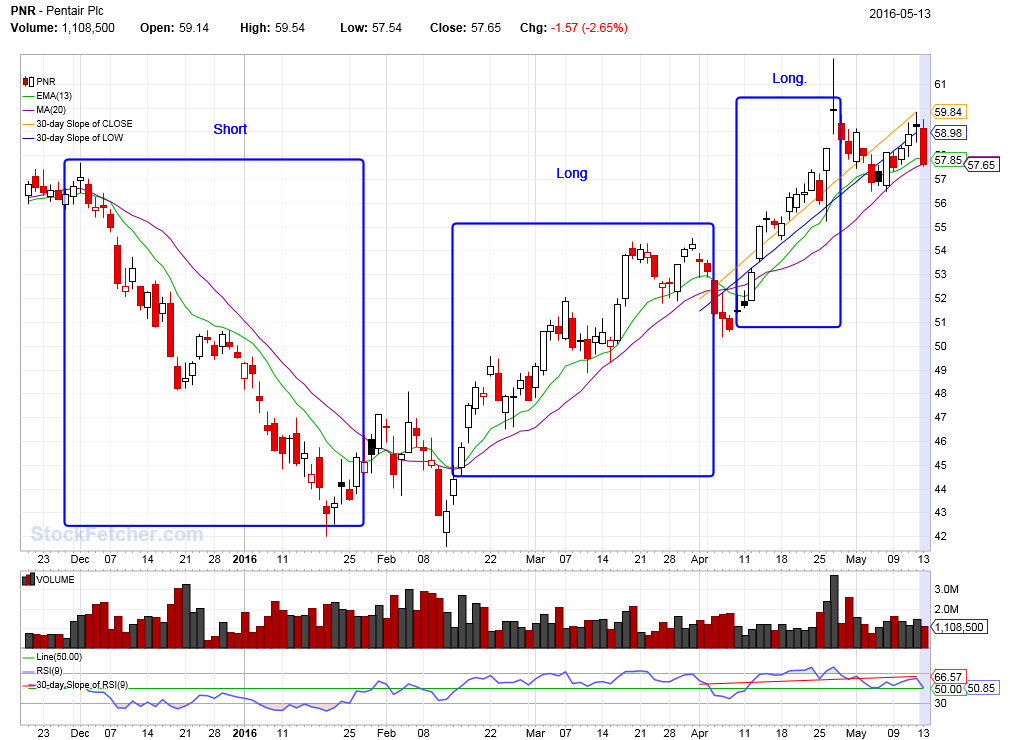
PNR popped up on FOUR filter on may 13th.

3 trade with this stock
1 short
2 long
Price crossed above or below ema(13) about the same time. A price that stay above the EMA(13) more or les with out a full break of that line and A RSI(9) above for bull and below for bear. = Trends!
Gaps between the 2 longs and the break down of price to EMA(13) shows to get out when price starts playing real near that line. Same as in the bear run which I have the box crossing into the braking of that downtrend and the failure of price to hold below the ena(13) . Thus a little sideway action before the first bull run. Just wonder is it best to watch a 2nd bullish candle above or below before calling a trend.


StockFetcher Forums · General Discussion · Best Search Setup for Finding Ranges<< >>Post Follow-up

*** Disclaimer *** StockFetcher.com does not endorse or suggest any of the securities which are returned in any of the searches or filters. They are provided purely for informational and research purposes. StockFetcher.com does not recommend particular securities. StockFetcher.com, Vestyl Software, L.L.C. and involved content providers shall not be liable for any errors or delays in the content, or for any actions taken based on the content.


Copyright 2022 - Vestyl Software L.L.C.Terms of Service | License | Questions or comments? Contact Us
EOD Data sources: DDFPlus & CSI Data Quotes delayed during active market hours. Delay times are at least 15 mins for NASDAQ, 20 mins for NYSE and Amex. Delayed intraday data provided by DDFPlus


This site is protected by reCAPTCHA and the Google Privacy Policy and Terms of Service apply.