| StockFetcher Forums · General Discussion · Interesting Book to read Daryl Guppy Trend trading | << 1 ... 7 8 9 10 11 >>Post Follow-up |
| graftonian 1,089 posts msg #135470 - Ignore graftonian modified |
4/17/2017 2:17:48 PM PT, At this time I think not. Thje investor group has been compressing since mid March, the "white space" is shrinking, and the there is is not much conviction in the volume. IMHO. My choice for today was EGO at 3.72 and it has gone nowhere. |
| pthomas215 1,251 posts msg #135471 - Ignore pthomas215 modified |
4/17/2017 2:31:57 PM thanks for your help. it's been a strange day in the markets. they market is up a lot but not much activity. Dont beat yourself up on ego. I would have bought it too if I saw it this morning. price just north of EMA 13, EMA 13 above MA20, and last few price points with an upward regression line. looked good. I think it is just a gold affiliation and gold is neutral today. |
| graftonian 1,089 posts msg #135472 - Ignore graftonian |
4/17/2017 2:53:35 PM If they hold up in the morning, SCON and TRCH are my choices. |
| nibor100 1,103 posts msg #135473 - Ignore nibor100 |
4/17/2017 3:17:56 PM @graftonian, 1. A couple of questions regarding EGO, if you don't mind: a. which of your Guppy filters did you use to find it as it appears its not the latest one you posted on the public filters thread? b. based on a recent response regarding Jan 5 picks, you seemed to indicate you stayed away from stocks with a recent gap up, yet it looks to me that EGO gapped upward on the 13th and again this morning. Is your personal gap up rule flexible allowing case by case assessment for stock suitability? 2. I was looking at your Guppy Revisited filter: a. in particular the 2 day slopes and on the charts that come up Stockfetcher indicates a color for the the 2 day slope lines, with a value with the same color box around it on the right axis, yet the value I see is identical to that for the given ratio not the value for the 2 day slopes show in the column data. Also no line is drawn in that color for the 2 day slope on my charts.. Am I missing something from my charts that is showing up on yours? b. Another area of possible interest might be the relationship of the more recent % Changes in Price vs. the 30 day Avg Day Range your filter is using, perhaps as a momentum or robustness gauge.... Thanks, Ed S. |
| graftonian 1,089 posts msg #135477 - Ignore graftonian |
4/17/2017 6:13:50 PM @ Ed S: a. which of your Guppy filters did you use to find it as it appears its not the latest one you posted on the public filters thread? ANS: I do not remember which of the 3 filters I used, and cannot seem to recreate the scenario. b. based on a recent response regarding Jan 5 picks, you seemed to indicate you stayed away from stocks with a recent gap up, yet it looks to me that EGO gapped upward on the 13th and again this morning. Is your personal gap up rule flexible allowing case by case assessment for stock suitability? ANS: I did not think the gap up was that large, and I have a genetic compulsion to break the rules. 2. I was looking at your Guppy Revisited filter: a. in particular the 2 day slopes and on the charts that come up Stockfetcher indicates a color for the the 2 day slope lines, with a value with the same color box around it on the right axis, yet the value I see is identical to that for the given ratio not the value for the 2 day slopes show in the column data. Also no line is drawn in that color for the 2 day slope on my charts.. Am I missing something from my charts that is showing up on yours? ANS: I did not intend for the 2 day slopes to be drawn, and revised the filter to eliminate them. b. Another area of possible interest might be the relationship of the more recent % Changes in Price vs. the 30 day Avg Day Range your filter is using, perhaps as a momentum or robustness gauge.... ANS: I will look into this possibility. Ed, I have 3 different GUPPY theory filters posted and am having trouble keeping them straight. I will do my best to post further stock candidates in the correct pigeon hole (thread). |
| dashover 229 posts msg #135492 - Ignore dashover |
4/18/2017 2:38:12 PM www.wishingwealth.com is a big fan of the Guppy approach... Recommended reading... |
| nibor100 1,103 posts msg #135500 - Ignore nibor100 |
4/19/2017 2:39:49 AM google chrome indicates that wishingweaath site is a malware site. perhaps its supposed to be wishingwealthblog.com Thanks, Ed S. |
| nibor100 1,103 posts msg #135550 - Ignore nibor100 |
4/20/2017 5:09:52 PM I've tried several of the group's Guppy filters but I could find none that finds FIZZ on or near Feb 6th. By the way, Darvas would have probably bought FIZZ on March 9th when it broke thru its all time high. Ed S. |
| Mactheriverrat 3,178 posts msg #135553 - Ignore Mactheriverrat modified |
4/20/2017 11:43:02 PM @nibor100 EDs I've added some code showing when the ema(60) starts to move. To me Daryl Guppy lets the cat out of the bag in a round about way of saying the EMA(60) can show start of long term trend change. Page 147 and 148 of his trend trading book. Go back and look at any stock and compare where the first movement of the ema(60) is compared to a down trend converts to a up trend Submit 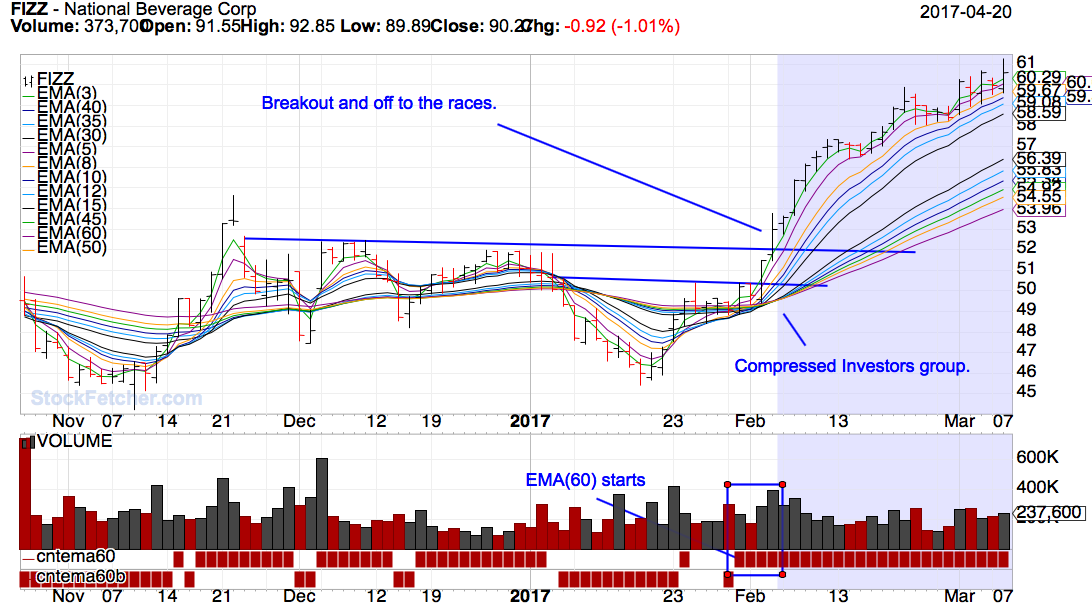 You might try the filter I posted on page 9 of this thread. Raise the price below 75 . It popped up on there. |
| Mactheriverrat 3,178 posts msg #135554 - Ignore Mactheriverrat |
4/21/2017 5:19:49 AM JWN - Updated post from 4-15-17 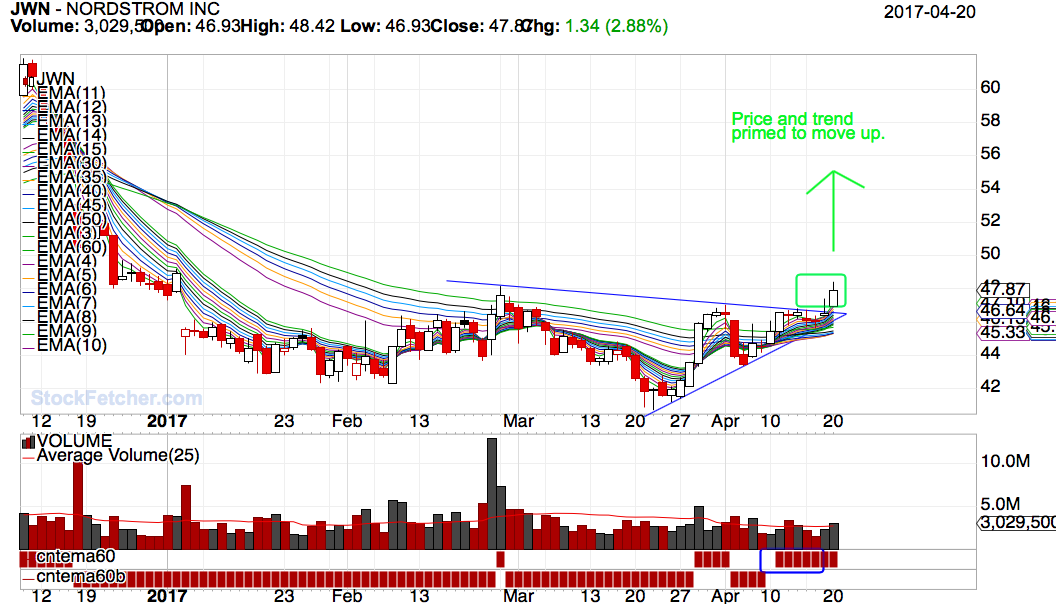 Get the picture! |
| StockFetcher Forums · General Discussion · Interesting Book to read Daryl Guppy Trend trading | << 1 ... 7 8 9 10 11 >>Post Follow-up |