| StockFetcher Forums · General Discussion · Stocks within X percent of 200MA? | << >>Post Follow-up |
| fotchstecker 314 posts msg #121682 - Ignore fotchstecker |
10/9/2014 2:17:21 PM Hi - I'm very new to SF. I did a little searching but didn't find anything along these lines. I'm afraid my attempt at creating it is still a little off. I'd like to generate a scan of stocks within some percent number of the 200MA. What's the syntax for something like this? Thank you. |
| fotchstecker 314 posts msg #121683 - Ignore fotchstecker |
10/9/2014 2:36:44 PM think i have it...? maybe? Close is less than 1% below the MA(200) // And Close is more than 60% above the MA(50) and average volume(30) is above 1000000 |
| four 5,087 posts msg #121704 - Ignore four modified |
10/10/2014 12:27:07 PM By using PPO, we can have a chart and then have a visual of the relationship of the close to the ema. i believe stockFetcher only goes to ema(100). To accomplish your request for ema(200), you will need to understand the calculation and put into Stockfetcher Discussion and calculation for PPO: http://www.investopedia.com/terms/p/ppo.asp As an example, I grabbed this picture where the close is 10% above the ema(100)... The filter is below the chart. 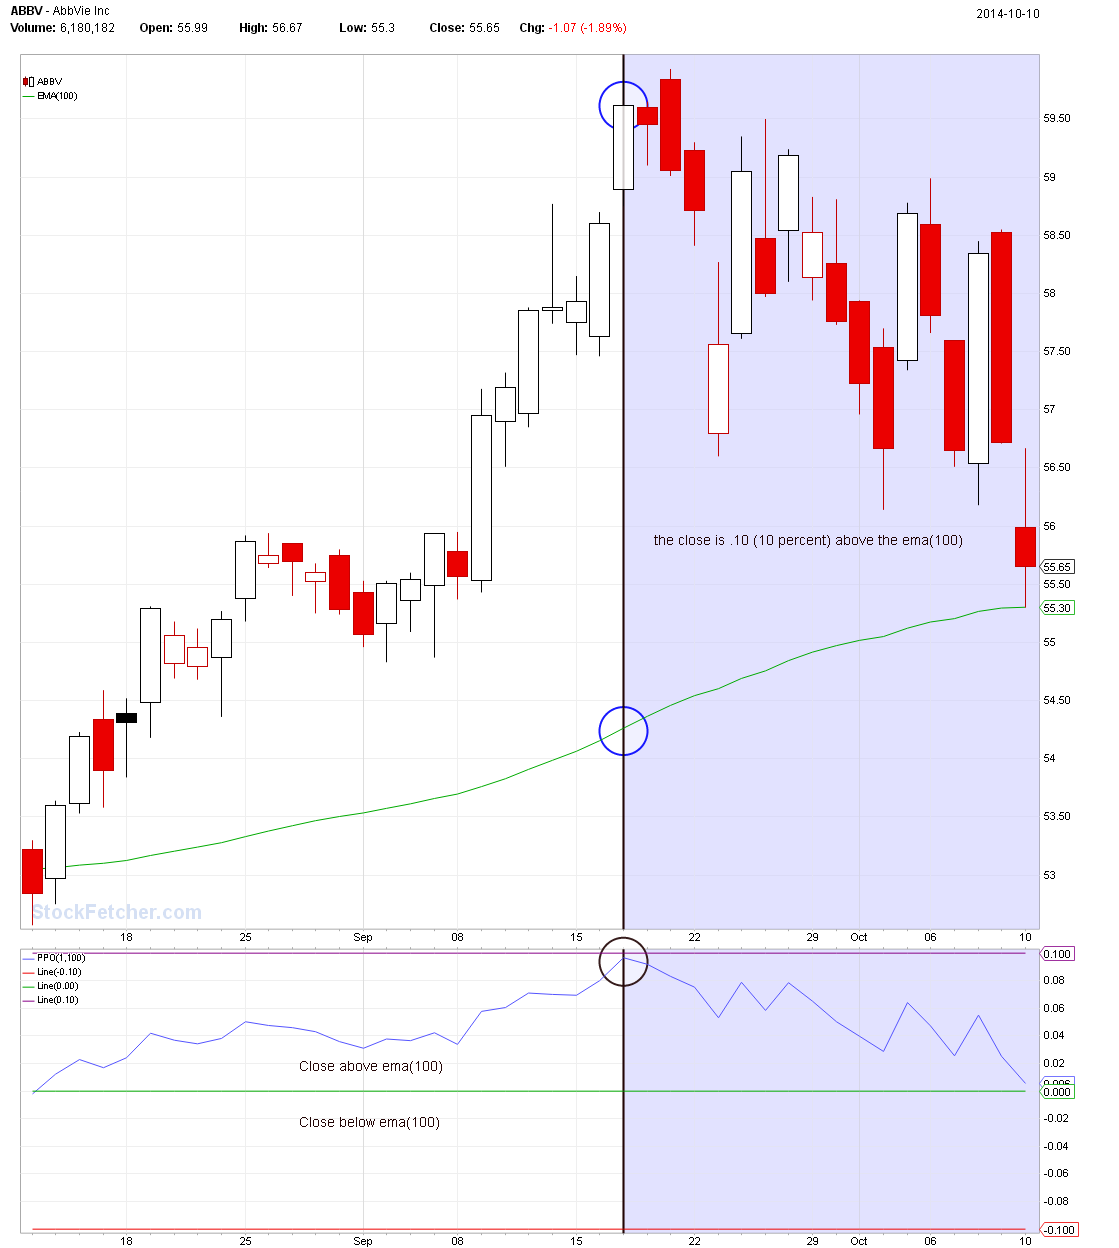 |
| fotchstecker 314 posts msg #121707 - Ignore fotchstecker |
10/10/2014 1:06:20 PM Four, many thanks for your feedback, explanation, and examples. I'm learning more and more here, and this kind of interaction is very helpful. Thank you for offering your time to help. |
| four 5,087 posts msg #121708 - Ignore four |
10/10/2014 1:23:37 PM welcome |
| StockFetcher Forums · General Discussion · Stocks within X percent of 200MA? | << >>Post Follow-up |