| StockFetcher Forums · General Discussion · The Money flow trading system | << 1 2 3 4 >>Post Follow-up |
| davesaint86 725 posts msg #156611 - Ignore davesaint86 |
4/15/2021 11:10:58 AM https://www.tradingview.com/x/JILGSWvX/ |
| Mactheriverrat 3,135 posts msg #156613 - Ignore Mactheriverrat modified |
4/15/2021 11:56:31 AM @davesaint86 Now that's a stage 2 Gerald Peters talks about. GREAT!!!!!! and my VIEW was stopped out . So I live to trade another day. So I lose a few dollars. |
| Mactheriverrat 3,135 posts msg #156619 - Ignore Mactheriverrat |
4/15/2021 10:25:35 PM Took a position BTU . See how this plays out. |
| brad421u 2 posts msg #156621 - Ignore brad421u |
4/15/2021 11:01:15 PM Good Luck on BTU. Looks like a good entry point. I did not know there's a forum here in stockfetcher. I have been paying for years not knowing one. silly me. |
| nibor100 1,010 posts msg #156624 - Ignore nibor100 |
4/16/2021 3:27:41 AM @Mactheriverrat, Regarding your comment from Apr14: "MAC(12,26,9) and histogram - Which you can't just have histogram on SF below is 2 statement work around: Ed S. |
| Cheese 1,374 posts msg #156631 - Ignore Cheese |
4/16/2021 10:07:44 AM nibor100 4/16/2021 3:27:41 AM https://www.stockfetcher.com/sfforums/?f=General-Discussion&tid=156561&start=99999&showall=1 do not draw macd Histogram(12,26,9) set{var1, macd Histogram(12,26,9)} draw var1 Legend{var1, macd Histogram(12,26,9)} PlotType{var1,zerobar} ============================================================================ Super ! THANK YOU, Ed S. |
| miketranz 956 posts msg #156636 - Ignore miketranz |
4/16/2021 12:24:54 PM CK out EBON.Buy low/sell high.Sounds easy right? |
| SAFeTRADE 630 posts msg #156638 - Ignore SAFeTRADE modified |
4/16/2021 5:04:36 PM For your entertainment and edit_fication. Draw a horizontal line across both Psar5 and Psar20 to get short and long term support and resistance. |
| Mactheriverrat 3,135 posts msg #156640 - Ignore Mactheriverrat |
4/16/2021 10:39:35 PM @nibor100 Thanks for that code. @brad421u On BTU I thought is was at least to the $5.00 resistance area before earnings on 4-28-21. So what if I only do get 20% but I'm not getting burned on a earnings play again. |
| styliten 279 posts msg #156642 - Ignore styliten |
4/17/2021 9:52:13 AM The recent V-shaped rebound of BTU looks very good/clear using linear regression: 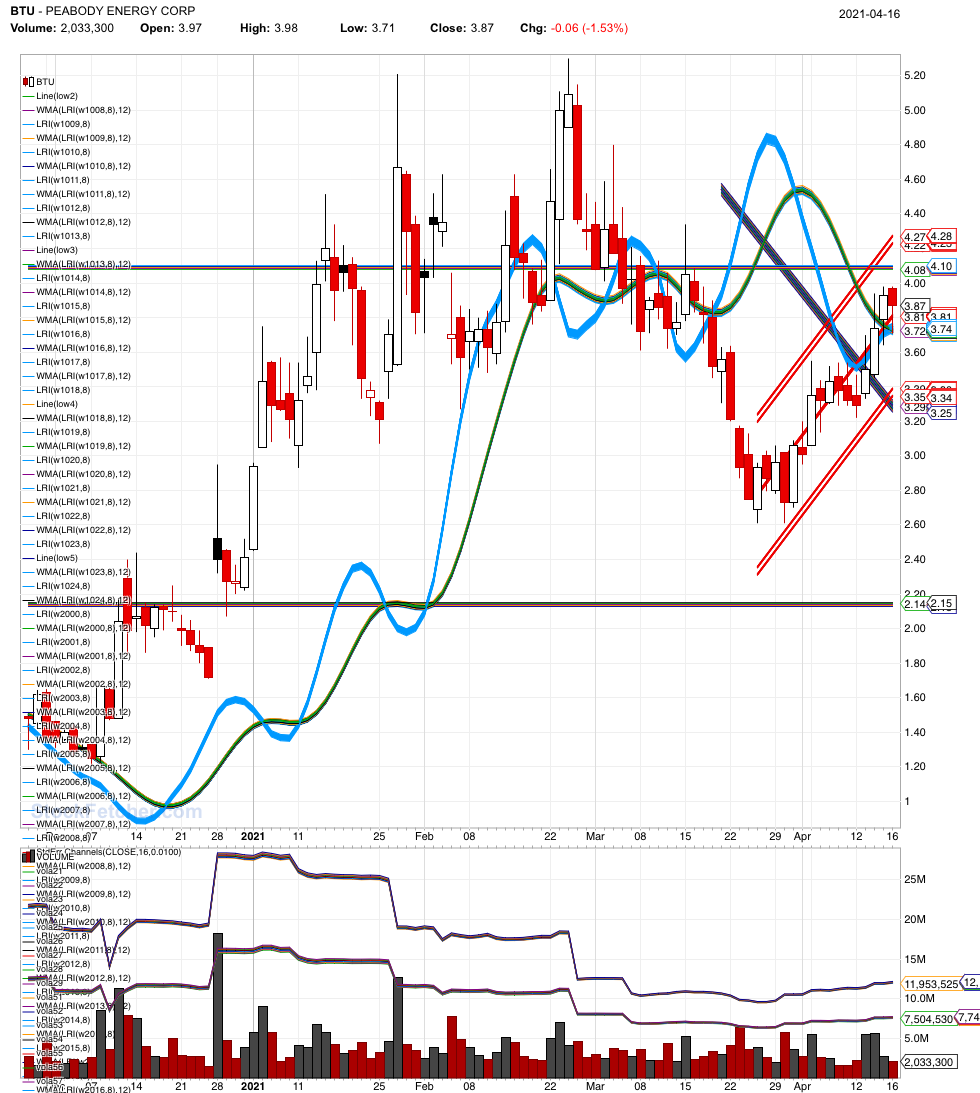 |
| StockFetcher Forums · General Discussion · The Money flow trading system | << 1 2 3 4 >>Post Follow-up |