| StockFetcher Forums · General Discussion · Which Technical Indicators trump others? | << 1 2 >>Post Follow-up |
| pthomas215 1,251 posts msg #131072 - Ignore pthomas215 |
9/11/2016 1:21:54 PM I would like to know trader opinions on which technical indicators are more important overall. Sometimes I see several pop up and I dont know how to qualify them. Any thoughts would be appreciated: 1) Slow Stochastic 2) Fast Stochastic 3) RSI 4) MACD 5) Elliott Wave 6) Commodity Channel Index 7) Triple MA crossover 8) Short term KST 9) Engulfing Line 10) Momentum 11) Outside Bar wondering how you would rank them in terms of importance. |
| Mactheriverrat 3,178 posts msg #131073 - Ignore Mactheriverrat modified |
9/11/2016 2:07:46 PM Guppy Gmma's or Hull Guppy GMMA. Resistance lines. Support lines. trend lines. Rsi 14 above or below 50 line the less the better. |
| gmg733 788 posts msg #131074 - Ignore gmg733 modified |
9/11/2016 2:16:48 PM Depends on they type of trading. Some of the best use Support and Resistance and trend lines. Strong set ups come at confluence points. As mac said, less is better. People often have too many or have several indicators that do the same. If you wanted to use indicators, make sure they are diverse. For instance, have one as a volume indicator, one price and etc. Having two based on the same principal does you little good. IMHO. I trade volatility, so I look at the volatility and liquidity first and foremost. Some options traders don't even look at charts (because you don't need too). But I like looking at charts. Something magical about it. |
| pthomas215 1,251 posts msg #131076 - Ignore pthomas215 |
9/11/2016 2:37:59 PM Thank you both. Mac, with RSI (14) you are referring to above 50 long, below 50 short I assume? 50 being the inflection point.? gmg733, that is what has been happening. I request all indicators on Fidelity and sometimes I get 3 bullish and 3 bearish on the same day. so when you trade short term volatility, do you look at VIX for a measure of what is going on right now? |
| Mactheriverrat 3,178 posts msg #131077 - Ignore Mactheriverrat |
9/11/2016 3:16:20 PM Draw RSI(14) line at 50 Look at a slew of charts and what the price action is compared to where RSI(14) is above or below the 50 line. |
| gmg733 788 posts msg #131080 - Ignore gmg733 modified |
9/11/2016 4:22:37 PM While I don't use what Mac said, it is true. I know someone who uses that. Works pretty good to tell if something is bullish or bearish. But it won't tell you what to trade. :) When I say I trade volatility I wait for the volatility on an underlying to be higher than normal and depending on my mood, I'm sell puts, selling strangles, sell calls. If I wanna be directional I'll trade vertical spreads (no real vol or theta play there, mainly delta). Its been tough for us options traders for the past few months. No vol means nothing to sell. So I've been swing trading grains, copper, Yen (been very very good to me this year), coffee and etc. You get good leverage out of futures. For swing trades I use s/r, trend lines, Keltner channels and 5EMA and 250EMA (to tell me which side I should be trading from). I'm a big fan of Joanne Klein and the work she has done. Look at her work, it fits most folks style, patience and time frames. This is where I got the 250EMA idea. She uses 250EMA to determine trend direction, SCTR to identify WHAT to trade, and the Slow Stoch on WHEN to trade it. http://stockcharts.com/public/1107832 |
| Mactheriverrat 3,178 posts msg #131082 - Ignore Mactheriverrat modified |
9/11/2016 5:13:49 PM I agree with gmg 733. Everyone trade's using different things and if you make some $ then more power to to them I use Alan Hulls version of Guppy GMMA averages . expanding longer averages not squeezing . First downtrend with the first day ema(3) up or there abouts. See the volume pick up after each new uptrend of a longer uptrend. The RSI(14) is nice but its really side chatter. 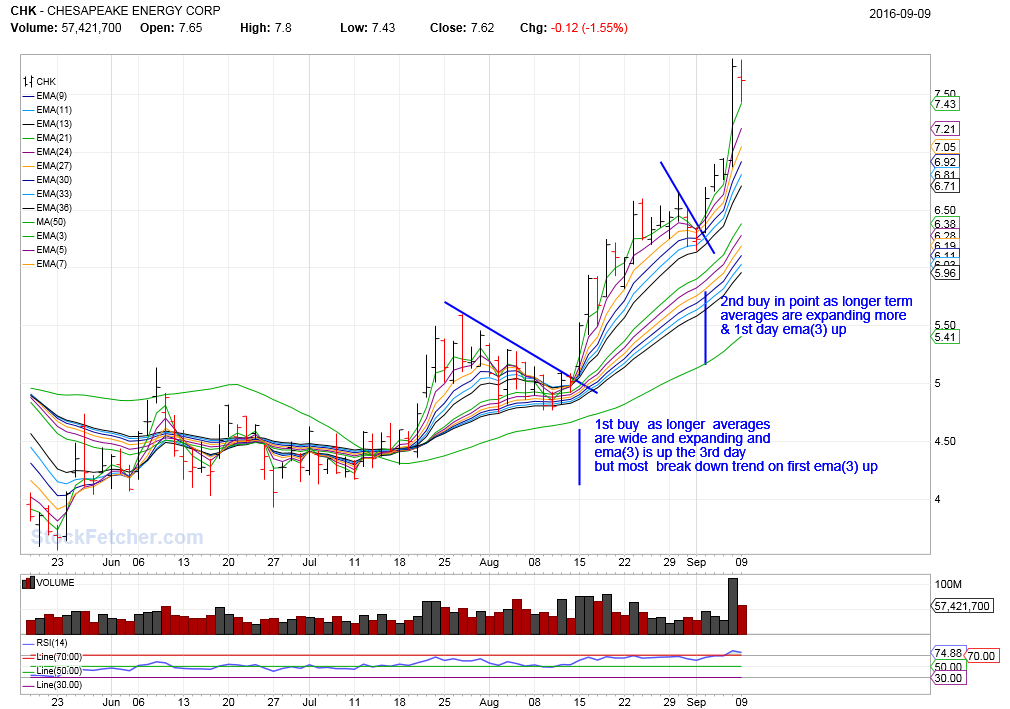 Say one entered @ 5.25 and held say to 7.25 Hmmm! Nice little profit I would say. One could even still hold as long as the price doesn't break down to many short term average. Just depends how long one want to let it ride. Could even see another up trend turn. Now trade something like DUST,NUGT, TVIX, UVXY one can get some big daily gains in a short time one can use the shorter tern averages and not worry about longer term averages until a true longer tend. These one can gain or lose their shirts very fast. |
| pthomas215 1,251 posts msg #131084 - Ignore pthomas215 |
9/11/2016 5:52:48 PM Mac, thanks. RSI (14) above 50 has some price correlation. I have seen more price correllation with rsi trending, no matter what the price--which is why I asked. but you have a valid point around better price action above 50 |
| Mactheriverrat 3,178 posts msg #131086 - Ignore Mactheriverrat |
9/11/2016 5:58:26 PM RSI(14) is good for uptrending stock. I haven't really compared it to those ETF stocks I was talking about like TVIX,UVXY,LABD and others. One could write a filter for up trending stocks say: Show stock where RSI(14) is above 50 |
| pthomas215 1,251 posts msg #131088 - Ignore pthomas215 |
9/11/2016 6:10:34 PM ok right on. Thanks Mac. with regards to the guppy material, do you have a benchmark you use to decide on whether long term investors are exiting, or is it a visual chart perspective? (i.e. just looking at it) |
| StockFetcher Forums · General Discussion · Which Technical Indicators trump others? | << 1 2 >>Post Follow-up |