| StockFetcher Forums · Stock Picks and Trading · Generic | << 1 2 3 4 5 ... 63 >>Post Follow-up |
| four 5,087 posts msg #119164 - Ignore four |
4/17/2014 11:28:17 PM |
| four 5,087 posts msg #119166 - Ignore four |
4/19/2014 2:07:37 AM http://seekingalpha.com/article/2145933-what-exactly-is-risk Larry Swedroe |
| four 5,087 posts msg #119227 - Ignore four modified |
4/26/2014 9:16:16 PM EXAMPLE 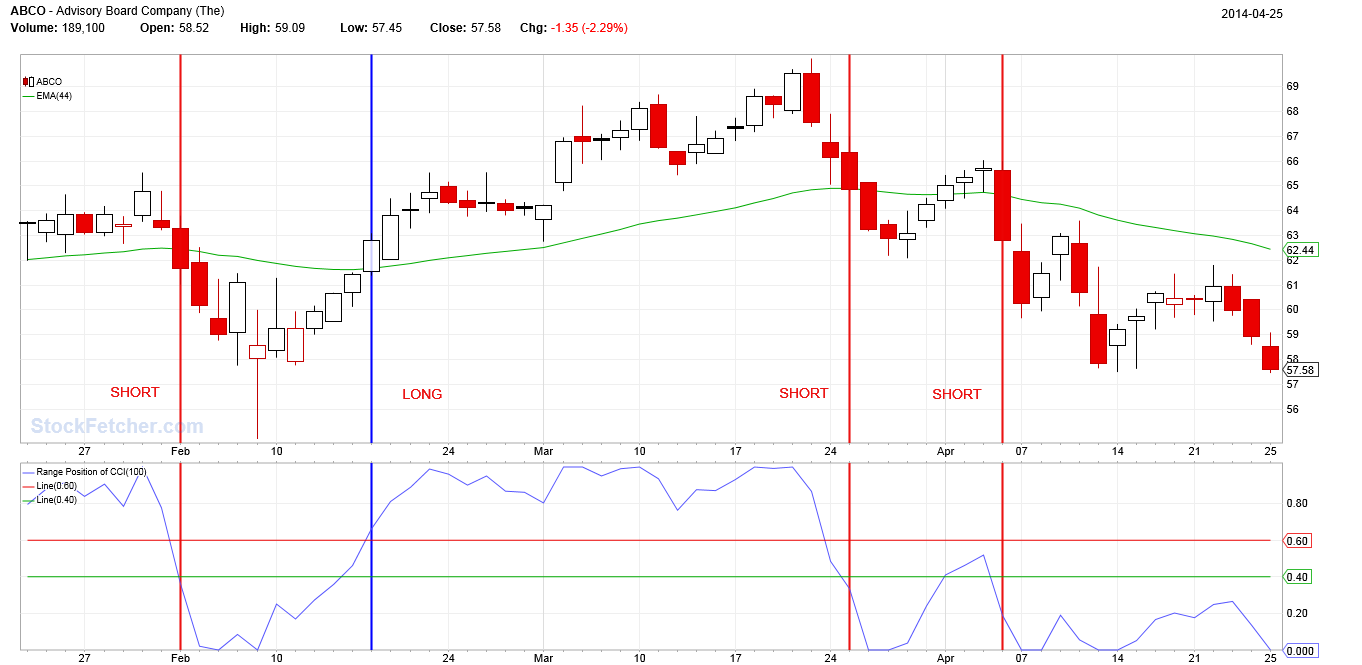 FOR MONDAY  |
| guspenskiy13 976 posts msg #119238 - Ignore guspenskiy13 modified |
4/27/2014 5:35:28 PM Can you explain the position of two lines at 0.4-0.6 on CCI? And does range position cci(100) = cci(100) or it's a different thing? Thanks. |
| four 5,087 posts msg #119240 - Ignore four modified |
4/27/2014 6:09:06 PM 4/27/2014 6:07:13 PM guspenskiy13 39 posts msg #119238 - Ignore guspenskiy13 modified 4/27/2014 5:35:28 PM Can you explain the position of two lines at 0.4-0.6 on CCI? too many false triggers using usual .5 crossover/under LONG :: must cross above .6 and ema(44) SHORT :: must cross below .4 and ema(44) And does range position cci(100) = cci(100) or it's a different thing? FROM: http://www.stockfetcher.com/forums/Indicators/IndPosition/37597 IndPosition Parameters Indicator Length Usage indposition(indicator,length) Description This measure returns the current position of an indicator with respect to the min and max of the measure over the specified number of days. The value returned will be between 0 and 1. Values closer to 0 indicate the measure is closer to the lower bound in the given period of time. Values closer to 1 indicator the current value of the measure is closer to making a high over the specified period of time. |
| guspenskiy13 976 posts msg #119241 - Ignore guspenskiy13 modified |
4/28/2014 4:30:35 PM Thanks for the information, I appreciate it. Have you back-tested this filter? Nice signal today. p.s. how did u get the ETF's from the filter? they dont show up for me on friday |
| four 5,087 posts msg #119244 - Ignore four modified |
4/28/2014 9:13:15 PM guspenskiy13 41 posts msg #119241 - Ignore guspenskiy13 modified 4/28/2014 4:30:35 PM Thanks for the information, I appreciate it. Have you back-tested this filter? Nice signal today. back-test visually... p.s. how did u get the ETF's from the filter? they dont show up for me on friday I scrolled through the filter returns and these two caught my eye (replaced Russell with ETFs)... presently, the filter is not set-up for a trigger on the short / long side |
| four 5,087 posts msg #119245 - Ignore four modified |
4/28/2014 9:27:38 PM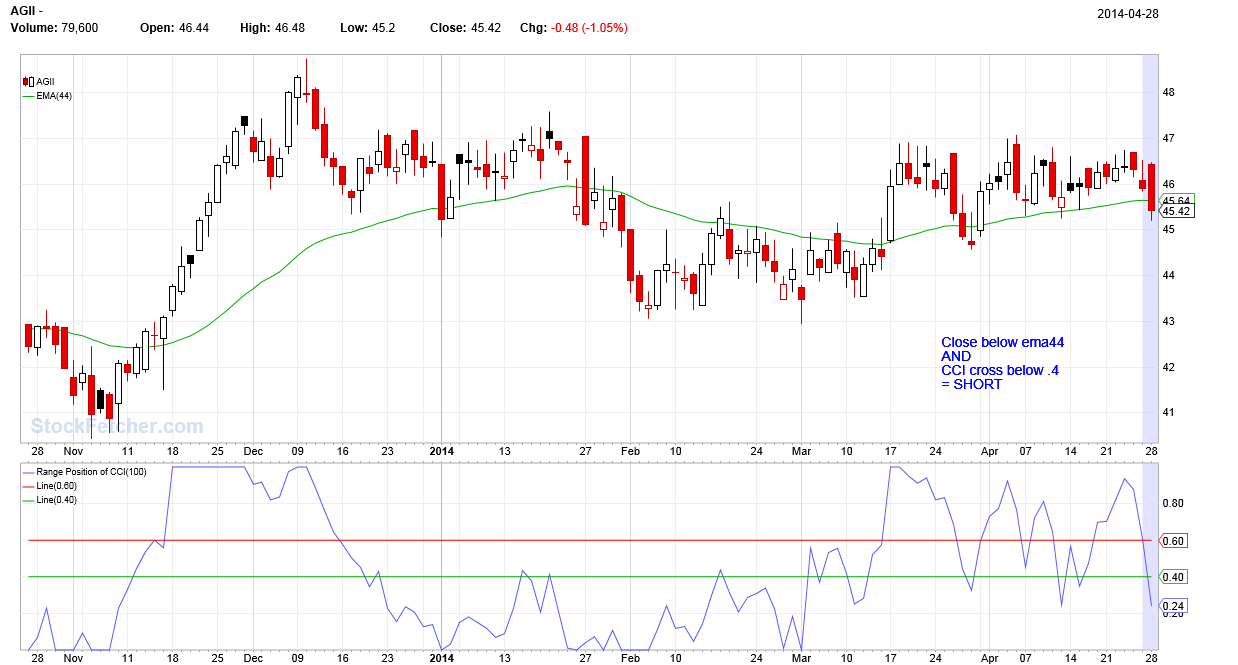 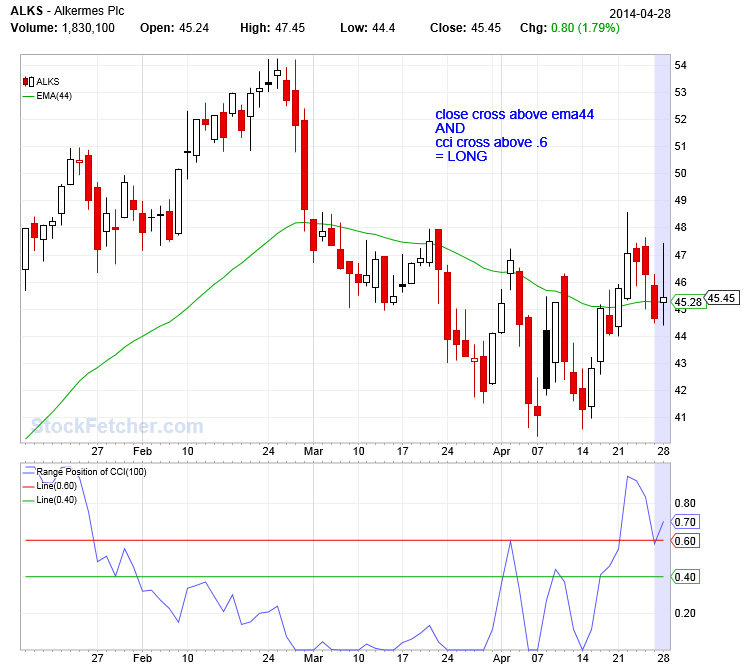 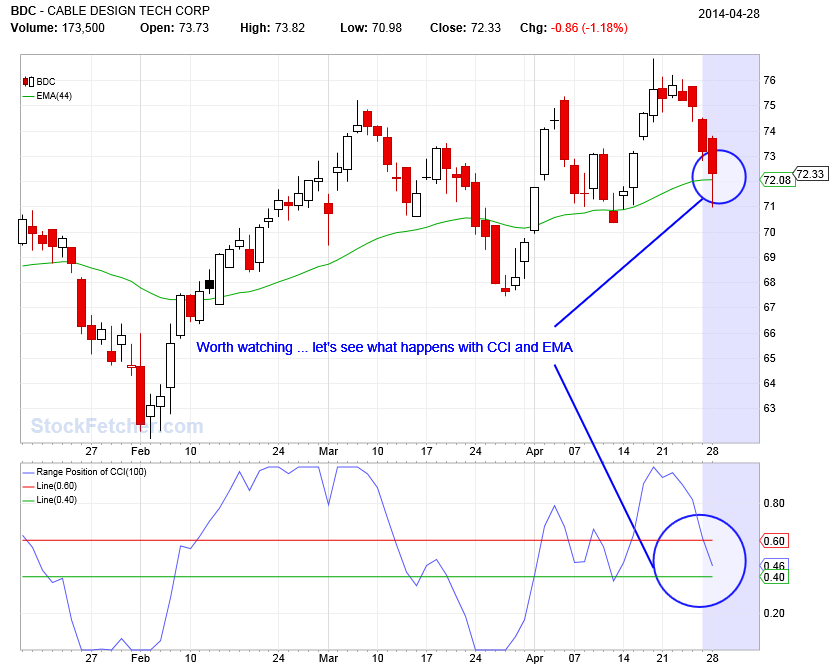 |
| alf44 2,025 posts msg #119272 - Ignore alf44 modified |
4/30/2014 1:22:33 AM . ... is that NEW implementation of the "44 period Moving Average" ... an "homage" to ME ??? I MUST say ... I'm VERY flattered !!! . |
| guspenskiy13 976 posts msg #119354 - Ignore guspenskiy13 modified |
5/5/2014 3:34:58 PM is TQQQ a buy for tmrw? CCI about to cross 0.6; price above ema(44) |
| StockFetcher Forums · Stock Picks and Trading · Generic | << 1 2 3 4 5 ... 63 >>Post Follow-up |