| StockFetcher Forums · Stock Picks and Trading · Generic | << 1 ... 44 45 46 47 48 ... 63 >>Post Follow-up |
| pthomas215 1,251 posts msg #129559 - Ignore pthomas215 |
7/2/2016 11:41:58 PM I never thought about it like that. I think I follow you, just by looking at the chart. I have always just looked at rsi and williams but this helps. does this accomplish the same concept? |
| four 5,087 posts msg #129560 - Ignore four modified |
7/3/2016 12:29:49 AM Let's start from scratch. Start by understanding my post. View the below information and image and then answer the questions. There are two Bollinger %B: bollinger %B(40,5) bollinger %B(5,5)  |
| pthomas215 1,251 posts msg #129561 - Ignore pthomas215 |
7/3/2016 12:59:12 AM ok. 1. b40, 5 is longer 2. b5,5 is shorter 1.longer indicator must break above . 5 2. longer indicator must stay above.6 for short longer indicator must hit and remain below .5 I think I understand most of it conceptually. so a stock is in a certain range for most of the time and Im trying to catch it when it goes outside the range. i suppose the june 27th data threw me off |
| four 5,087 posts msg #129563 - Ignore four modified |
7/3/2016 1:10:07 AM Your answers and (My comments are in bold) ok. 1. b40, 5 is longer (TRUE) 2. b5,5 is shorter (TRUE) LONG longer indicator must break above . 5 (break above .6) longer indicator must stay above.6 (remain above .5) (bollinger %B(5,5) below .4) Now you do the SHORT entry... |
| pthomas215 1,251 posts msg #129564 - Ignore pthomas215 |
7/3/2016 1:50:14 AM short: longer indicator must break below .6 longer indicator must stay below .5 bollinger %B(5,5) above .6 |
| four 5,087 posts msg #129565 - Ignore four |
7/3/2016 11:51:15 AM Your answers and (My comments are in bold) short: longer indicator must break below .6 (break below .5) longer indicator must stay below .5 (stay below .6) bollinger %B(5,5) above .6 (TRUE) |
| four 5,087 posts msg #129566 - Ignore four modified |
7/3/2016 1:01:39 PM Here is another... using your rsi (trigger) and williams (longer trend) 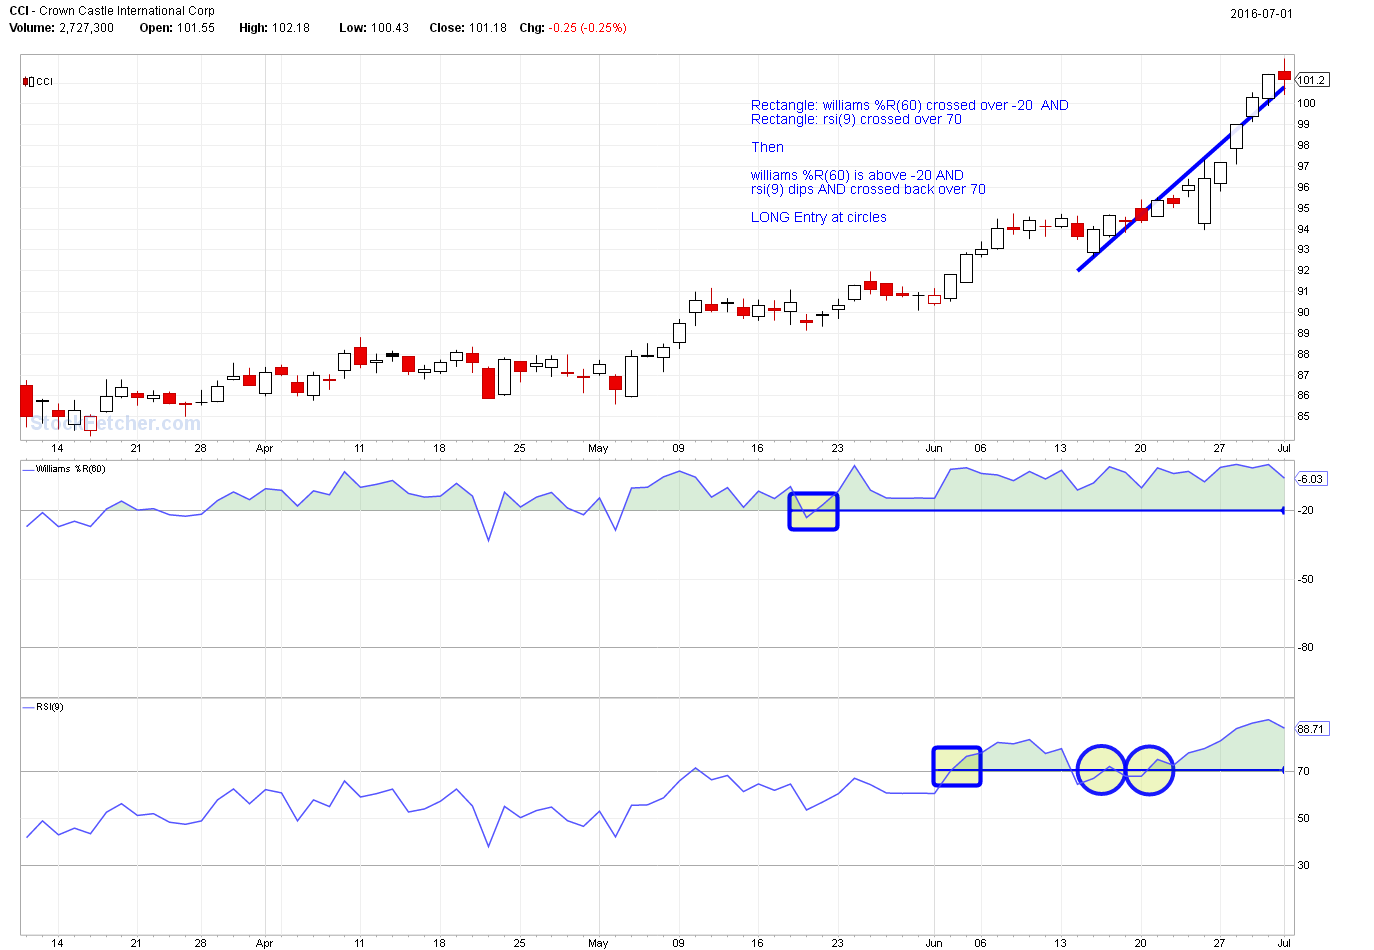 |
| pthomas215 1,251 posts msg #129567 - Ignore pthomas215 |
7/3/2016 1:22:33 PM thank you four. Im getting there. do you use that last one you posted with williams and rsi as a filter? |
| four 5,087 posts msg #129568 - Ignore four |
7/3/2016 1:33:24 PM I just put it together because you, previously, mentioned using rsi and williams. Glad my charts are making sense to you! |
| pthomas215 1,251 posts msg #129569 - Ignore pthomas215 |
7/3/2016 1:38:10 PM yeah it helps. just thinking in terms of more days, fewer days helps understand trending. |
| StockFetcher Forums · Stock Picks and Trading · Generic | << 1 ... 44 45 46 47 48 ... 63 >>Post Follow-up |