| StockFetcher Forums · Stock Picks and Trading · UPS Ascending Triangle Breakout. | << 1 2 3 4 >>Post Follow-up |
| Mactheriverrat 3,178 posts msg #159435 - Ignore Mactheriverrat |
8/11/2022 6:05:57 PM Well WLK is the only real play as far as Ascending Triangle breakout trading is concerned. |
| Mactheriverrat 3,178 posts msg #159443 - Ignore Mactheriverrat |
8/12/2022 1:49:51 PM Not bad at all If I say so myself. PFE needs to break above resistance line. SWIM Breaking above resistance line MOMO needs to break above resistance line HIMX breaking above resistance line WLK from yesterday having a good follow through. 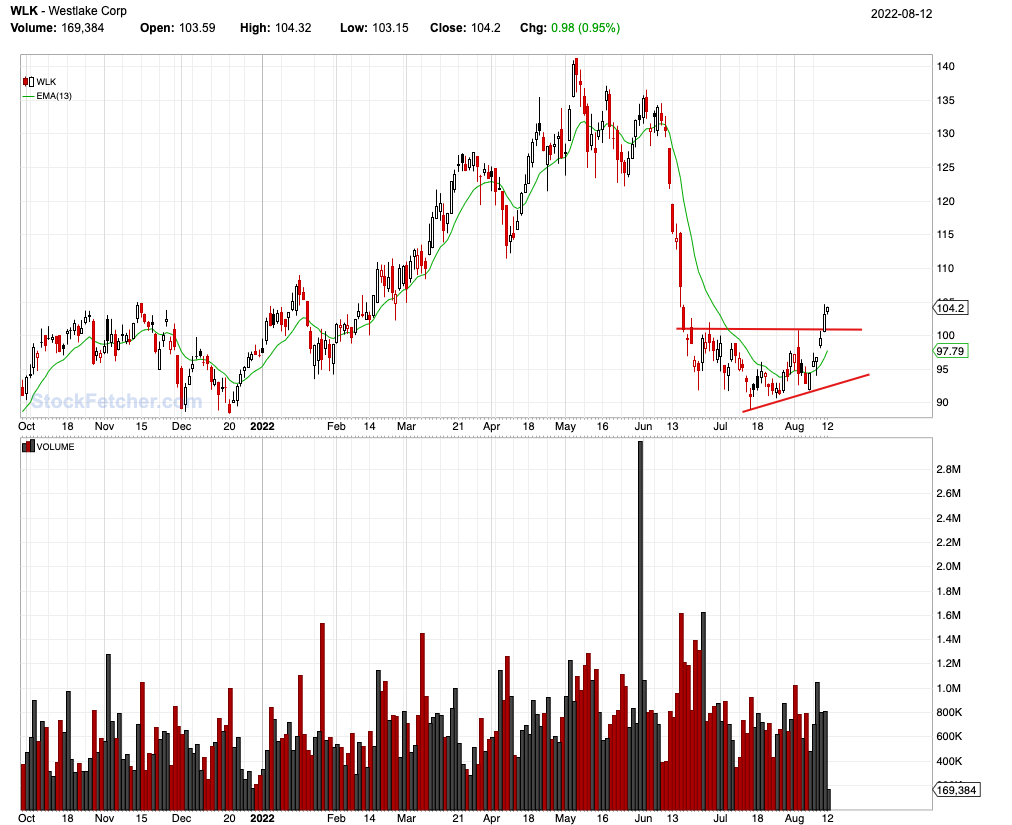 |
| shillllihs 6,102 posts msg #159444 - Ignore shillllihs modified |
8/12/2022 1:52:27 PM You are giving a great effort given the economic situation. Way to go MAC! |
| styliten 350 posts msg #159445 - Ignore styliten modified |
8/12/2022 2:00:18 PM @ Mac Just shown up on the radar now, Symlist(BRCC, VLDR, ELAN, HAYW, WH, SMTC, HCC, SIMO, ALKS, NEM, BSAC)  |
| Mactheriverrat 3,178 posts msg #159450 - Ignore Mactheriverrat |
8/12/2022 9:43:16 PM Actually shillllihs I'm rather surprised by the amount of Ascending triangles that show up. I'm still narrowing down the fields but everyday I go through my EMA 13 above EMA 13 one day ago. I draw support and resistance in any resemblance of Ascending triangles. After about a week to 10 days one will have more than enough to where one can see Ascending triangles forming patterns of breakouts. Then I look at the EMA 13 above MA 20 from day one. I can then make a symlist of good pattens. It takes a little bit of work but I've been messing with this for about three to four weeks. Like with everything that nothing is perfect but messing with Ascending triangles breakouts sure improves the odds. Draw ema(13) draw ma(20) and RSI(14) for way overbrought positions which is usually around some past resistance. /* 1313 is number of consecutive days EMA(13) above (+)/below(-) previous EMA(13) */ set{1313b,days( ema(13) is above ema(13) one day ago ,250)} set{1313a,days( ema(13) is below ema(13) one day ago,250)} set{13x13, 1313a - 1313b} and add column 13x13 {13_x_13} Set{cntema13aboveema13,count( eMA(13) > eMA(13) 1day ago,1)} draw cntema13aboveema13 Set{cntema13aboveema13b,count( eMA(13)< EMA(13) 1day ago,1)} draw cntema13aboveema13b /*e13m20 is number of consecutive days ema(13) above5(+)/below(-) previous MA(20) */ set{e13m20b,days( ema(13) is above MA(20) ,250)} set{e13m20a,days( ema(13) is below MA(20) ,250)} set{e13m20, e13m20a - e13m20b} and add column e13m20{e13m20} do not Draw e13m20 Set{cntema13overm20,count( ema(13) > ma(20) ,1)} draw cntema13overm20 Set{cntema13overm20b,count( ema(13) < ma(20) ,1)} draw cntema13overm20b/*e13m20 is number of consecutive days ema(13) above5(+)/below(-) previous MA(20) */ set{e13m20b,days( ema(13) is above MA(20) ,250)} set{e13m20a,days( ema(13) is below MA(20) ,250)} set{e13m20, e13m20a - e13m20b} and add column e13m20{e13m20} do not Draw e13m20 Set{cntema13overm20,count( ema(13) > ma(20) ,1)} draw cntema13overm20 Set{cntema13overm20b,count( ema(13) < ma(20) ,1)} draw cntema13overm20b Its simple and its works. Don't need 10000 indicators to just give one Analysis Paralysis. |
| Mactheriverrat 3,178 posts msg #159451 - Ignore Mactheriverrat |
8/12/2022 9:49:30 PM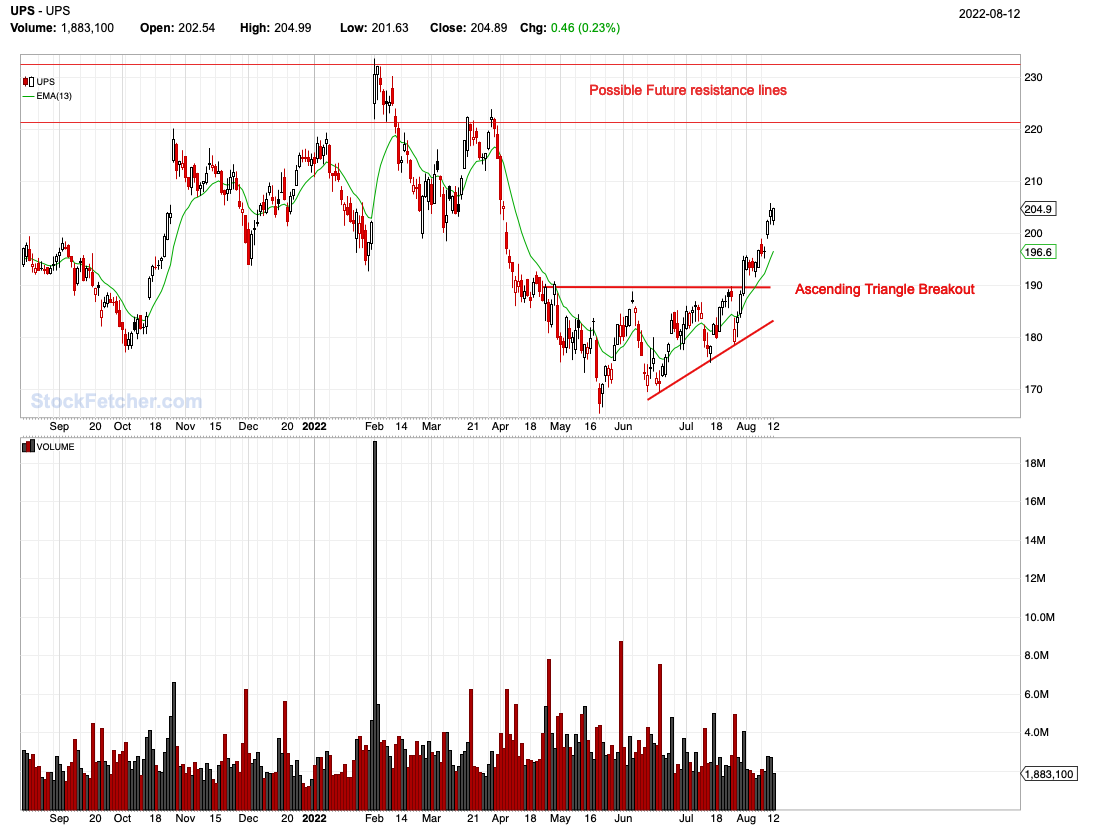 |
| Mactheriverrat 3,178 posts msg #159464 - Ignore Mactheriverrat |
8/15/2022 10:45:08 PM Ascending Triangle breakout on above average volume. 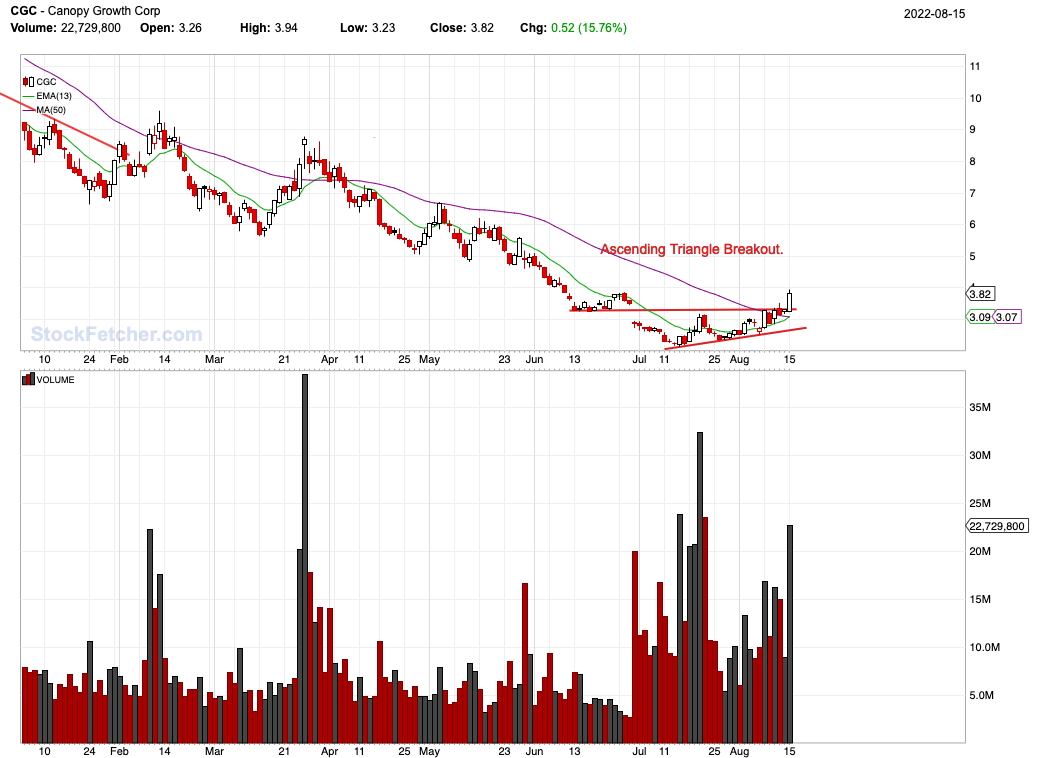 |
| Mactheriverrat 3,178 posts msg #159471 - Ignore Mactheriverrat |
8/18/2022 12:14:22 PM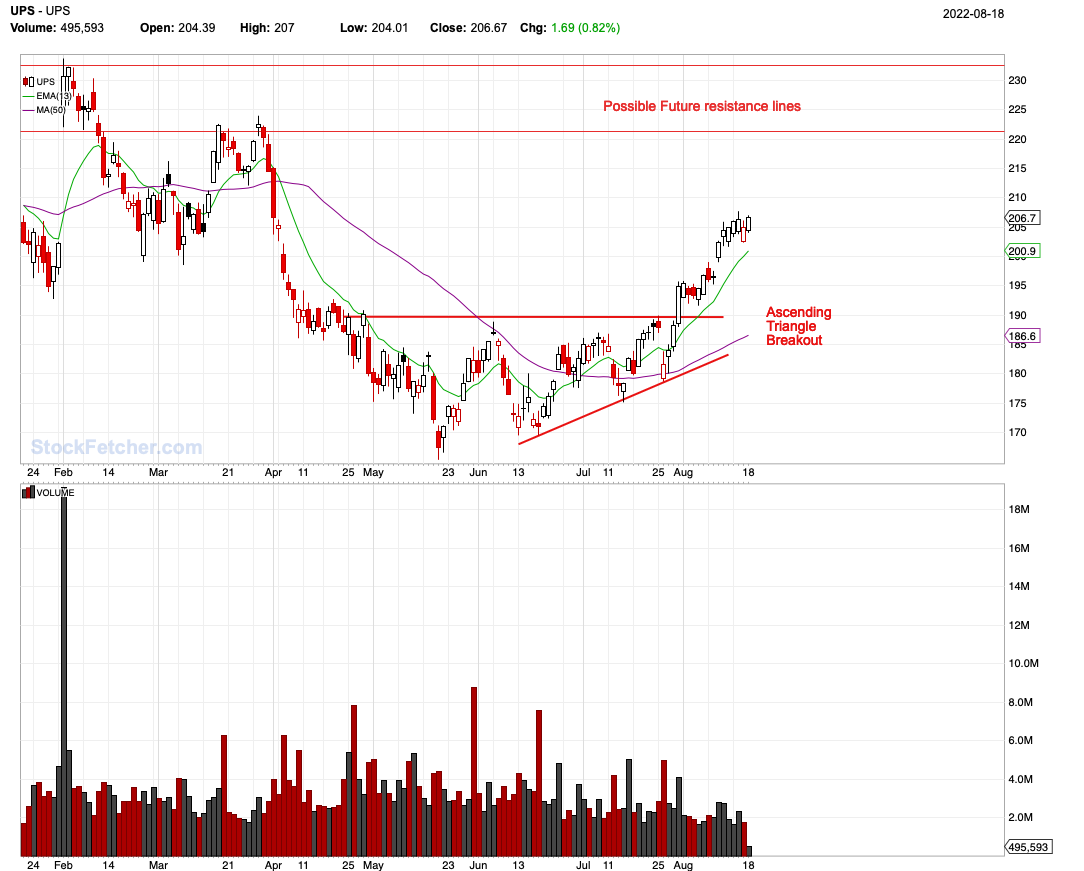 |
| Mactheriverrat 3,178 posts msg #159472 - Ignore Mactheriverrat |
8/18/2022 4:40:18 PM Thursday End of day 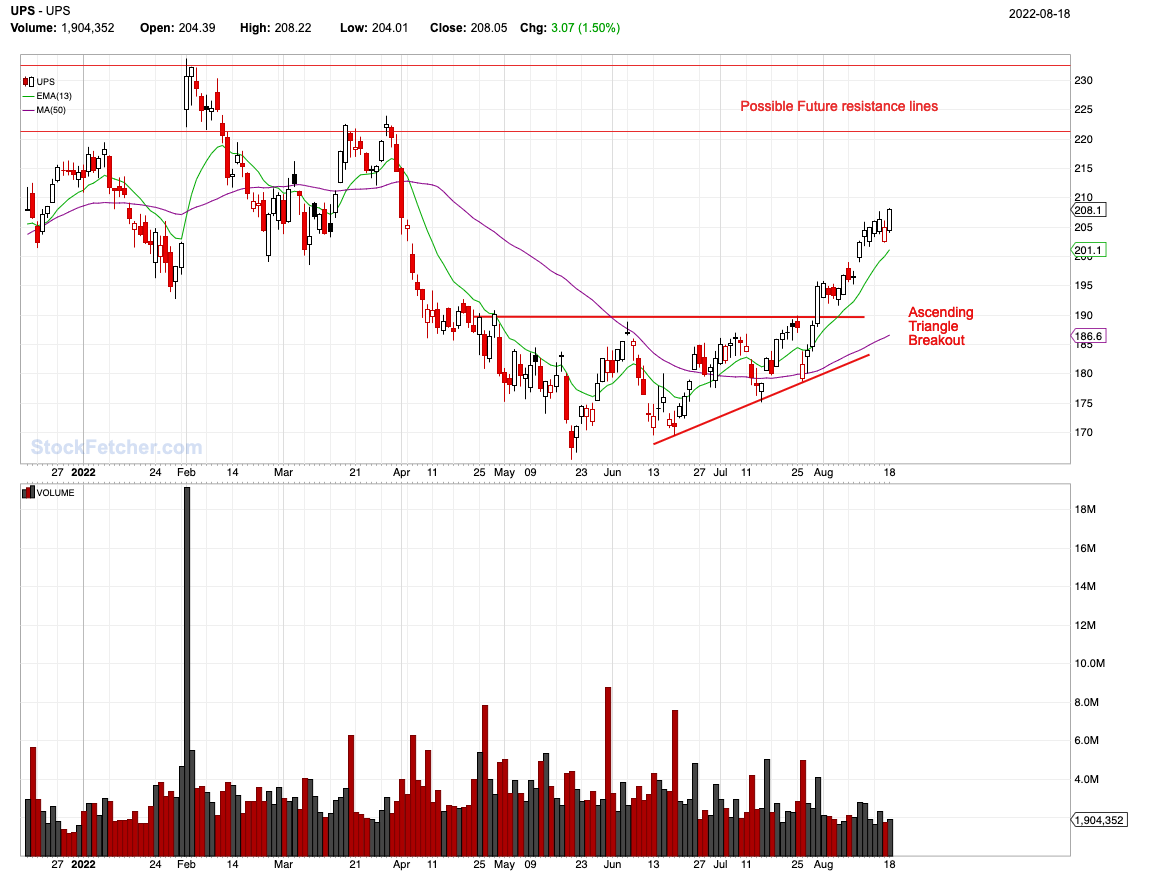 |
| Mactheriverrat 3,178 posts msg #159474 - Ignore Mactheriverrat |
8/19/2022 8:44:09 PM Ascending triangles is catching the breakout more or less and riding the trend. Some days price is up and some days it's down. 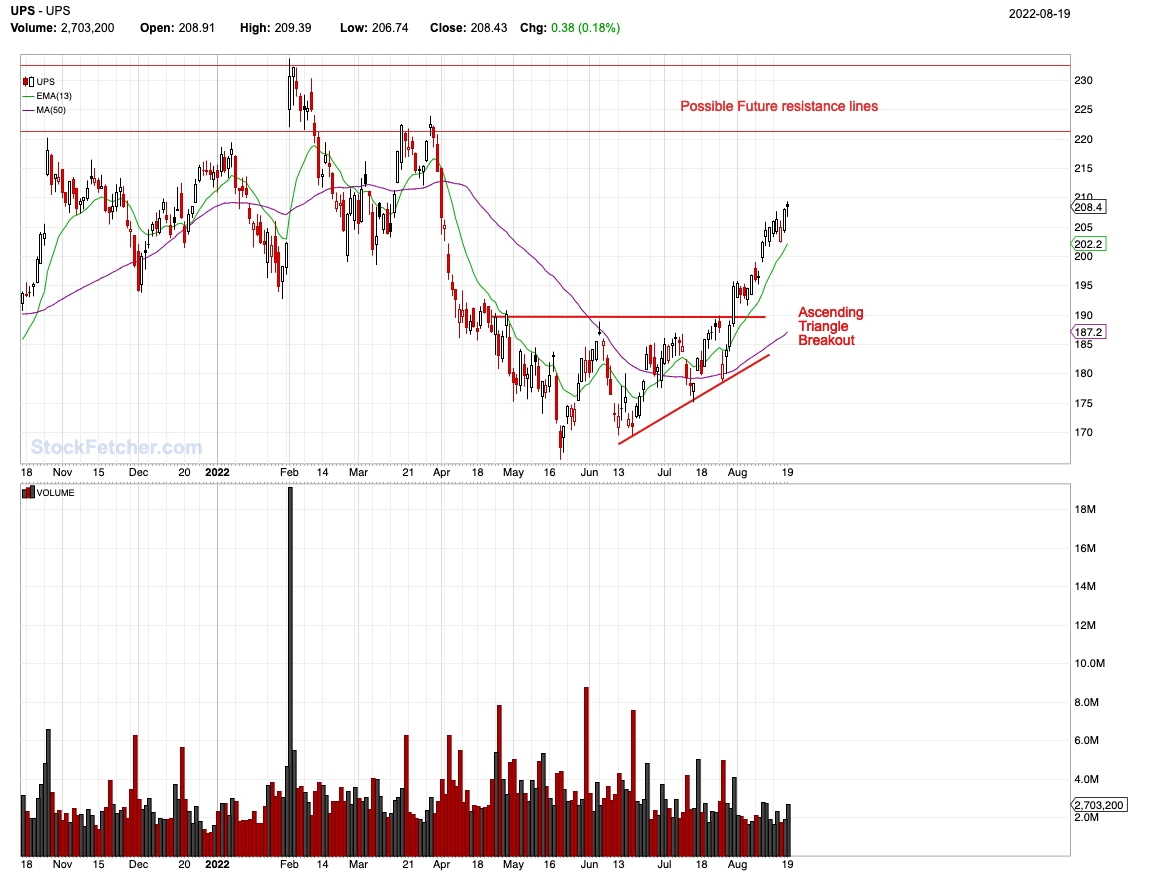 |
| StockFetcher Forums · Stock Picks and Trading · UPS Ascending Triangle Breakout. | << 1 2 3 4 >>Post Follow-up |