| StockFetcher Forums · Filter Exchange · The RED LIGHT ... GREEN LIGHT Trading System ! | << 1 2 3 4 >>Post Follow-up |
| alf44 2,025 posts msg #117468 - Ignore alf44 modified |
12/20/2013 9:52:13 PM . "I'm not sure I see the value" ! . 
..........In The Land Of The Blind ... The One-Eyed Man Is King !!! . |
| jimmyjazz 102 posts msg #117474 - Ignore jimmyjazz |
12/21/2013 10:51:55 AM alf, I'm gonna do you a favor. I promise to let you know when you actually contribute something of value. Until that point, assume you're just a boat anchor on this forum who isn't half as funny or smart as you think you are. Happy Holidays. |
| Kevin_in_GA 4,599 posts msg #117475 - Ignore Kevin_in_GA |
12/21/2013 11:46:27 AM I played around with PSAR variations before, and for me at least they work best as a trend indicator on the weekly chart. I tested thousands of PSAR input combinations as entry and exits limits using StrataSearch, and in general they are poor performers on the daily chart - I found only a very few combinations that actually beat a simple buy and hold over the last three years. The usual combos were unprofitable as daily trading signals - only parabolic SAR(0.08,0.01) worked as a winning system, and that was a surprise since the magnitude of the inputs is usually the smaller number first. |
| alf44 2,025 posts msg #117482 - Ignore alf44 modified |
12/21/2013 9:11:41 PM . .... I have posted a "Daily Chart Set-Up" that I continue to tweak ! It is "a work in progress" ... as I stated previously ! It is NOT (in it's current manifestation) a "scan" / "filter" etc... I'm certainly not pushing it on anyone ... in fact, I couldn't care less if goofs like the one above can or can't ... "see it" ! ----- The Parabolic SAR indicator is an important part of this "Chart Set-Up" ... and is plotted in a NEW and entirely different way ! Although, as important a part as I happen to think it is ... it is still ONLY ONE PART of the Chart Set-Up ! Lastly, to look at and to focus entirely on this ONE indicator as though it is somehow meant to be used as a "stand alone" ... ... and to ignore everything else ... reveals a level of misunderstanding and ignorance that frankly is laughable !!! ----- I post this ... from a hotel room ... on an iPad ... propped up in bed watching Mavs vs Suns ... GO Mavs !!! Merry Christmas Everyone !!! Hopefully, Santa will bring some of you a NEW pair of eyeglasses this year !!! . |
| alf44 2,025 posts msg #117500 - Ignore alf44 modified |
12/24/2013 12:26:31 AM . ............................... Joy To The World !!! . . |
| Eman93 4,750 posts msg #117517 - Ignore Eman93 |
12/26/2013 1:37:38 AM This is cool.. nice work as always! |
| novacane32000 331 posts msg #117533 - Ignore novacane32000 |
12/26/2013 10:11:47 PM Not to hijack this thread but I assume those are the three wise men pictured in the video. Interesting to note that the bible does not teach there were three wise men. Matthew says there were "wise men" but it does not state how many. |
| Eman93 4,750 posts msg #117535 - Ignore Eman93 |
12/27/2013 2:29:04 AM Magi? |
| alf44 2,025 posts msg #117540 - Ignore alf44 modified |
12/27/2013 1:15:05 PM . I mentioned in a previous post ... ---------- "Plotting the P-SAR along with the Accumulative Swing Index "seemed" like a natural as BOTH of these indicators were developed by Welles Wilder. I also happen to like the ASI for other reasons. There IS a bit of a problem with this approach however. The ASI is well ... "accumulative" ... that is ... over time it's value can become VERY POSITIVE or VERY NEGATIVE ! When that happens, the P-SAR values which are still based on Price ... and the ASI values which have NOTHING to do with Price ... can become SO far apart that it results in a plot in which BOTH can become very compressed and look a bit odd. I don't like this occasional "glitch" when displaying both (ASI & P-SAR) together ... but, I haven't come up with a better idea as of yet." ---------- In an attempt to address this issue I decided to create a lower plot that ... like P-SAR ... IS BASED ON PRICE ! As the saying goes ... Price Is King ! This will definitely alleviate the "compression" issue I described previously... ... I decided to plot a 3 day average of the Daily Pivot ... plot the P-SAR on THAT (instead of on the ASI as is shown in previous charts). Do keep in mind that the "P-SAR" is just an overlay on the lower indicator ... it's actual values are still based on the price plot above. UPDATE : 3.) 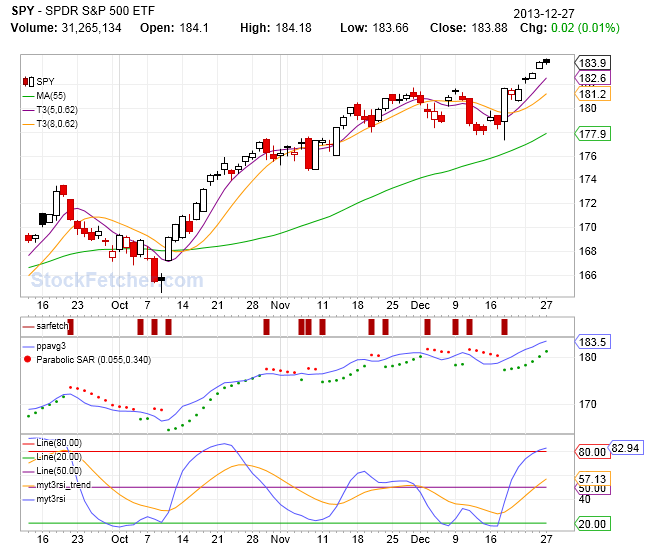 . . One nice benefit of this 3 day average PP plot ... in fact, similar to the previous ASI plot ... it's very easy to draw TREND LINES etc... !!! Go ahead and snicker ... THAT'S RIGHT ... I said ... "TREND LINES" !!! Anyone remember those ??? LOL KICKIN' IT OLD SCHOOL !!! ----- FYI : I also shortened the MA(144) to a MA(55). This tightens up the way the price plot is displayed ... while still providing a bit of a longer term perspective. It continues to be ... a "work in progress" ! . |
| alf44 2,025 posts msg #117541 - Ignore alf44 modified |
12/27/2013 3:00:07 PM . This is cool.. nice work as always! Thanks Eman93 ! . |
| StockFetcher Forums · Filter Exchange · The RED LIGHT ... GREEN LIGHT Trading System ! | << 1 2 3 4 >>Post Follow-up |