| StockFetcher Forums · Stock Picks and Trading · Shills Swing N Daily | << 1 ... 205 206 207 208 209 ... 486 >>Post Follow-up |
| shillllihs 5,979 posts msg #130824 - Ignore shillllihs |
9/3/2016 12:00:08 AM I don't know too much about candles but isn't that a spinning top on Spy? |
| pthomas215 1,251 posts msg #130826 - Ignore pthomas215 |
9/3/2016 12:46:29 AM I dont know enough about candlesticks to tell, but it does seem that we are at a point of indecision on the spy. fed is propping this up. notice how the jobs number was bad but not horrific? this is quite the puzzle. |
| Mactheriverrat 3,135 posts msg #130827 - Ignore Mactheriverrat |
9/3/2016 1:07:20 AM From stock chart. Long-Legged Doji Long-legged doji have long upper and lower shadows that are almost equal in length. These doji reflect a great amount of indecision in the market. Long-legged doji indicate that prices traded well above and below the session's opening level, but closed virtually even with the open. After a whole lot of yelling and screaming, the end result showed little change from the initial open. ------------ Its a Bollinger band squeeze IMHO. Smallest BB width in many years. |
| StefanM 25 posts msg #130828 - Ignore StefanM |
9/3/2016 4:53:23 AM Reading candles is not difficult. But reading candles correctly does not mean that you will make a winning trade with the next candle. You guys are experienced enough to know this. If you want to spend a little time on it then you can search Google for "VSA cheat sheet". VSA is the anaylsis of spread and volume. Spread is the spread of the candle, high to low. On a Doji bar buyers and sellers move the price up and down, but it closes with a low spread between open and close. So buyers and sellers are undecided. For me one of the most interesting bar types is a bar with a very small spread compared with the previous bars, but on higher than usual volume. Imagine you had big strong green candles in a row up to the top of a range, but suddenly you see a small bar with low spread but high volume. What else should it mean than that sellers came in that capped the bar on its way up to new highs ... |
| pthomas215 1,251 posts msg #130831 - Ignore pthomas215 |
9/3/2016 11:00:37 AM Thanks Stefan. helps--I really dont trade/invest using candlesticks at all so I will check out that cheat sheet. Lately, the market has been so fickle and crazy it is forcing me to day trade. overnight surprises are common unfortunately. |
| StefanM 25 posts msg #130832 - Ignore StefanM |
9/3/2016 11:45:45 AM I don`t refer to candlesticks like "dark cloud cover" or whatever these may be called. But in case that one does not only trade it`s system - I mean going long on a short day because the backtest is good in total - some few candlesticks may be interesting to look at. And this maybe in combination with the volume. On the other hand I can not recommend this trading method without limitation. Focussing on a system means to be limited on a limited number of instruments, but also to have clear promising rules. So if one trades a profitable system then he maybe should actually ignore how single bars looks like. As I always say, looking at bars is like looking at women. There is always one that appears to be more attractive. But maybe it is better to stay with the one you`re with. Sorry for my poor English .. :-))) |
| pthomas215 1,251 posts msg #130834 - Ignore pthomas215 |
9/3/2016 11:58:10 AM stafan your english is great. and yes, looking at candlesticks is like looking at attractive women...only difference is I have never seen a candlestick talk back to me, live in a house that I pay for or prevent me from seeing my children. !! does it seem like gold is going to swing up now? any thoughts on it? It seemed like there was a head fake a few days ago and then down again. |
| Mactheriverrat 3,135 posts msg #130837 - Ignore Mactheriverrat |
9/3/2016 2:19:49 PM Using Guppy GMMA one not even use candles- Using the longer term group as trend direction and shorter term group as pull back buy in on first day up as a new uptrend of a stronger longer term group uptrend. Look at CHK using (Chart-type is line). Now this doesn't work always with stocks TVIX that use more of the shorter term averages. Thus is why I say GOLD is dead as the longer term group is heading south. If over the next couple of weeks or so DUST turns north one could see some great gains. I just can't see if the markets are making new highs that people will still stay in GOLD. 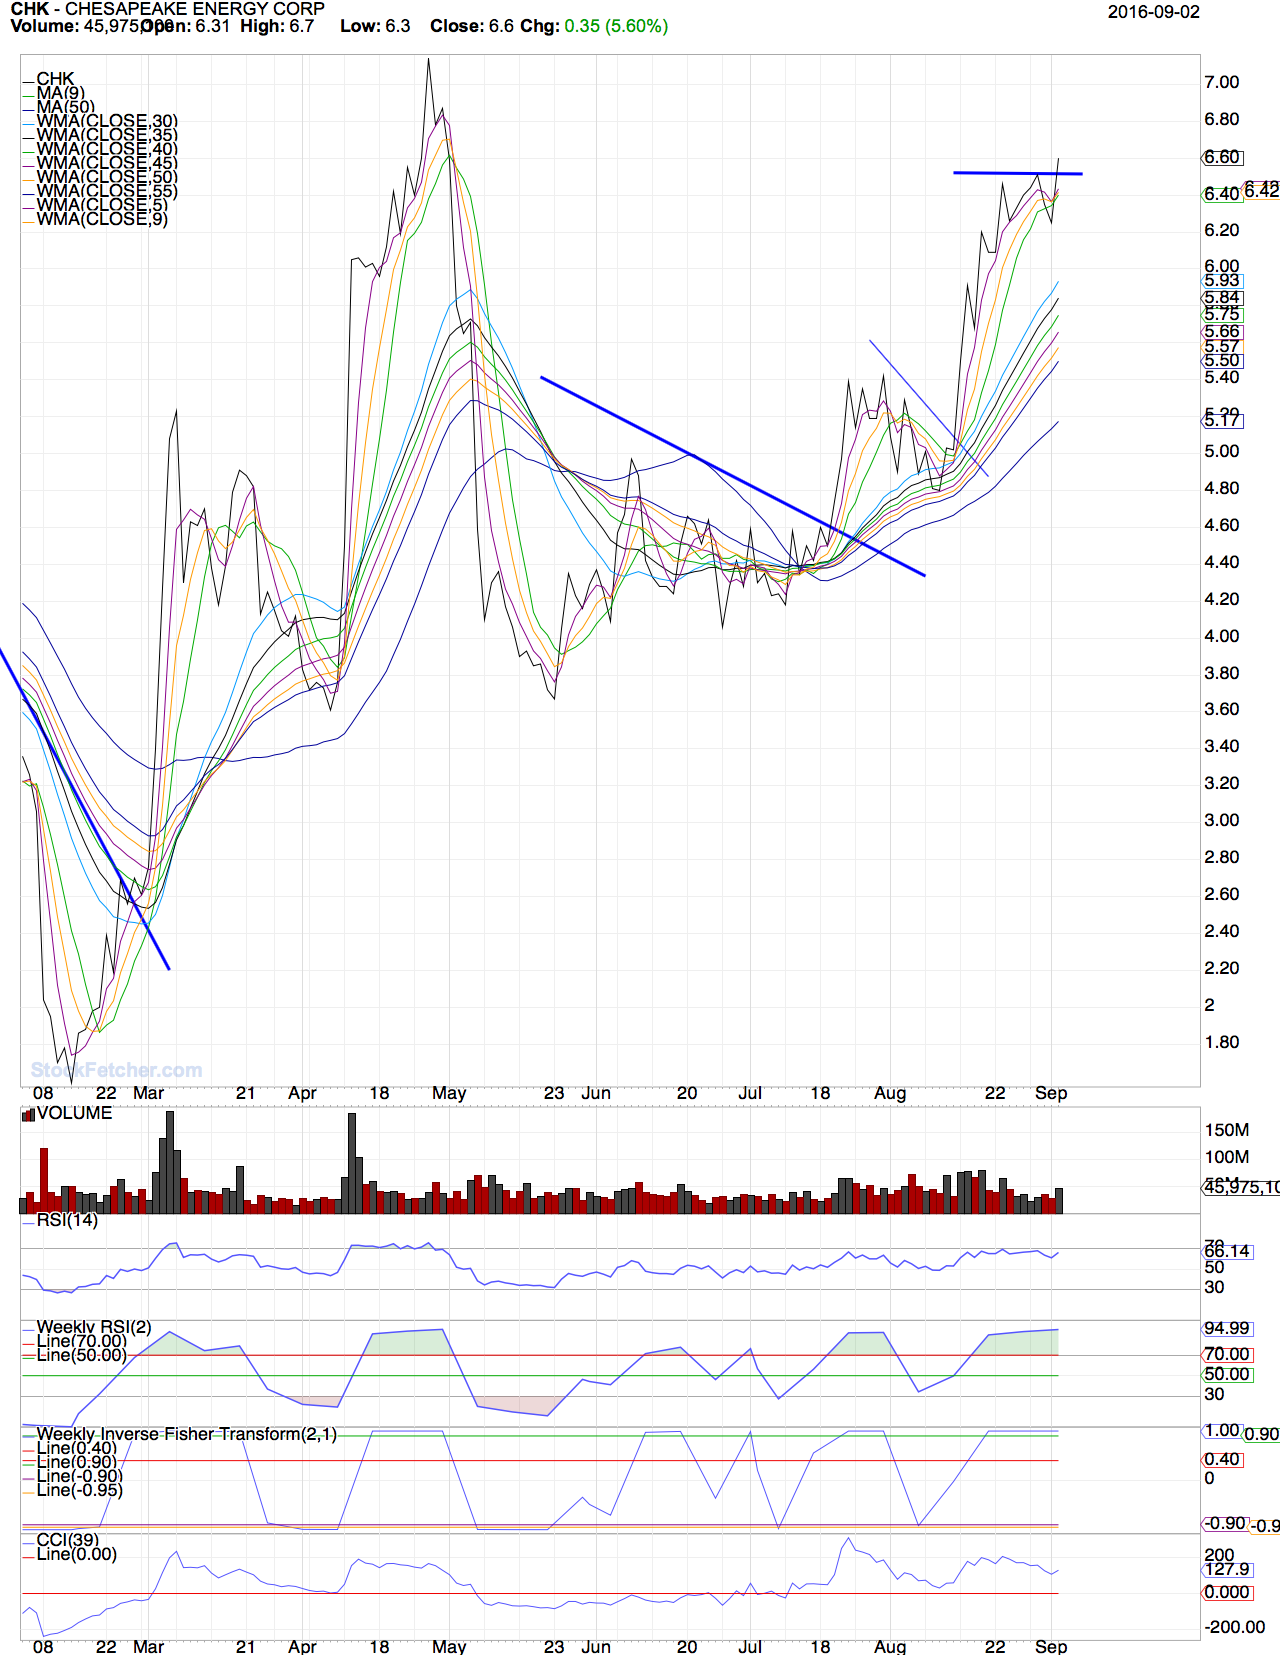 |
| pthomas215 1,251 posts msg #130838 - Ignore pthomas215 |
9/3/2016 2:28:37 PM mac,, correct. you are helpful as always. my feeling conceptually is that gold is like bonds. i.e. a pullback means gold and bonds dont gain much. but a major correction like the one we have coming....gold up, tvix up, bonds up. |
| Mactheriverrat 3,135 posts msg #130847 - Ignore Mactheriverrat |
9/3/2016 9:21:58 PM Here is one set up to make a run to the next resistance line. S Sprint 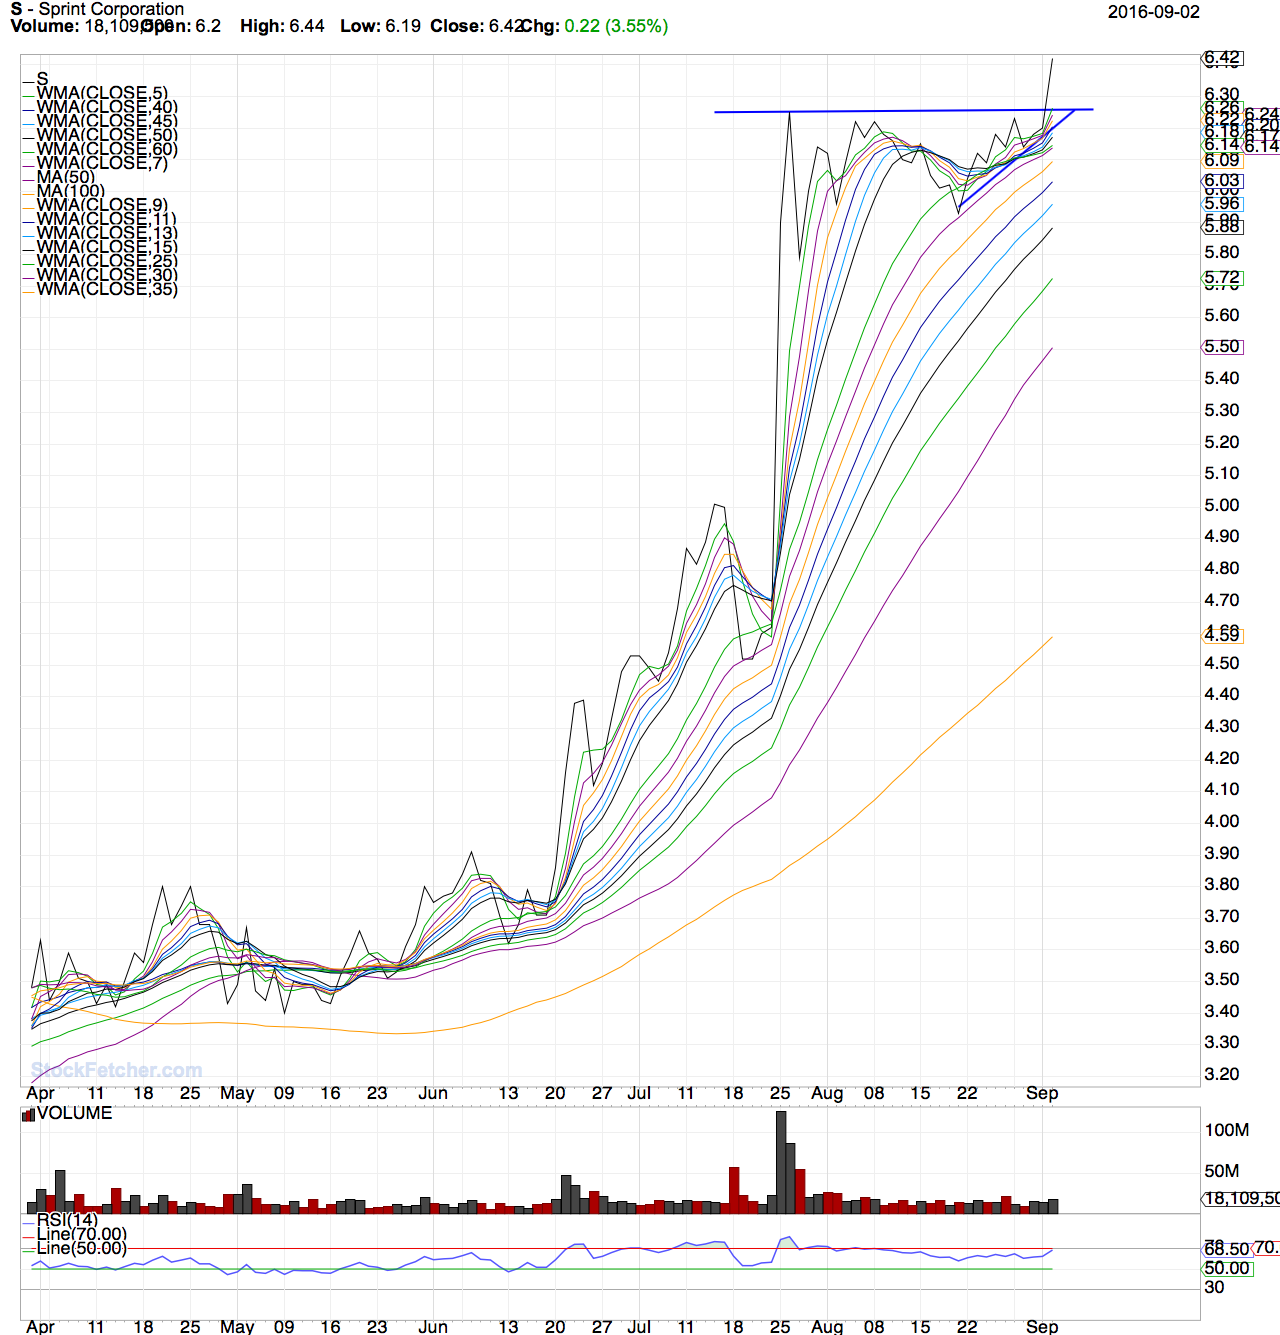 |
| StockFetcher Forums · Stock Picks and Trading · Shills Swing N Daily | << 1 ... 205 206 207 208 209 ... 486 >>Post Follow-up |