| StockFetcher Forums · General Discussion · Help... sub-penny stocks not displaying correctly | << >>Post Follow-up |
| BuffaloBill 17 posts msg #116661 - Ignore BuffaloBill |
11/11/2013 12:28:23 AM Hi, I would appreciate it if someone could explain why the following happens and how I might resolve it. When viewing filter results, certain sub-penny stocks show long periods (months) of 'flat-line' looking charts. Rather than show the true up/down price movement over a given period of time, the chart displays a solid horizontal line. This problem only occurs when the view is set to any of the following: Table - Clean Table - Watch List Table - Classic <<===== PROBLEM The 'flat-line' charts display just fine if the view is set to any of the other options: Charts - Default Charts - Tiny Charts - Small Charts - Large Charts - Huge <<===== NO PROBLEM I guess my 'problem' is that I prefer using the 'Table - Classic' view, but that won't display these subs correctly. I use logarithmic scaling and think that may have something to do with why the price looks so squished. It seems like the first three views ignore the log-scale setting - the vertical distances look more linear than log. A couple stocks that don't display correctly (in Classic view): LVGI and REAC Thanks Bill |
| stockfetcher 980 posts msg #116663 |
11/11/2013 6:17:51 AM Hi, Please send support@stockfetcher.com an email with your filter text and snapshots of the issues you are seeing. Thank you, StockFetcher.com Support |
| BuffaloBill 17 posts msg #116681 - Ignore BuffaloBill |
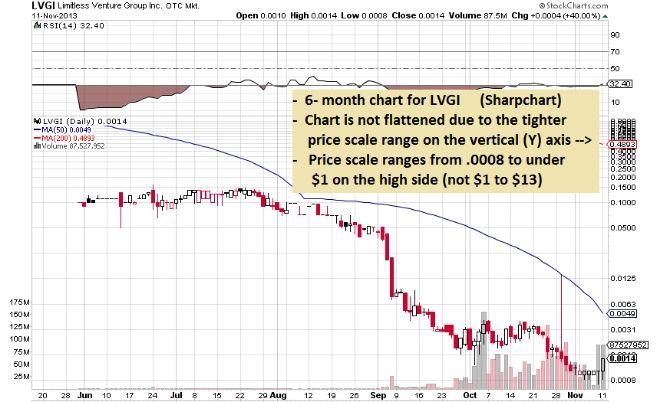
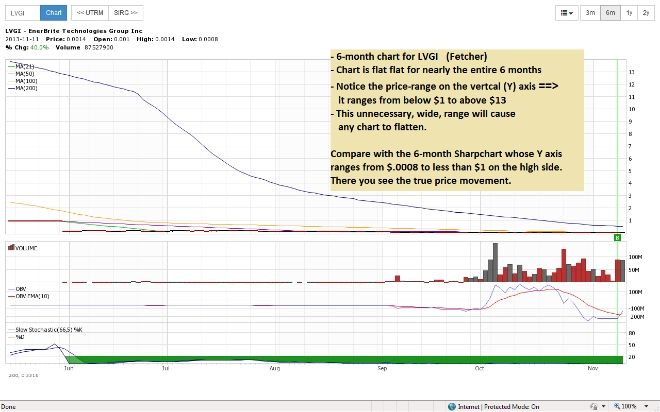
11/11/2013 11:45:42 PM Hi, Thanks for the quick reply. I think I know what may be causing the squished, flat-looking charts. It's the RANGE of the price-scaling on the vertical Y axis. Fetcher's price-range seems too large on some stocks for a given time period, causing them to flatten, I did a comparison between two 6-month charts of LVGI - one Fetcher - one Sharpcharts. SEE CHARTS at END OF POST (each chart was set to logarithmic scaling) The Sharpchart charting function seems to use something like the following logic in regard to price-scaling: - What is the time-period to chart/display - What is the lowest and highest price within that period - Once identified, add a little extra space at the bottom and top of the chart by decreasing the low price and increasing the high price just a little. - Last, fit that price-scale within the vertical boundaries of the chart window, then plot the chart. By keeping the range to a minimum, Sharpcharts show every little chart movement. Whereas, certain SF charts seem to create a wider-than-necessary price-scale range, squishing the chart, though this occurs with only a few symbols. Don't get me wrong, I've been a Stockfetcher fan for many years and plan on many more. You provide a great service, great support, and at a great price. I'm just hoping there's a way to prevent this from happening. This is how I got to LVGI: - Ran this filter: "where volume is above 200000 and price is below 1.00" - My View is: Table - Classic - Clicked on the first stock name in the list to open the chart window - Set the chart period to: 6 months You should also see the same flat-looking chart with AQUM if you look thru the scan results in Fetcher. I appreciate your time... Bill SHARPCHART - 6 MONTH CHART OF LVGI: |
| stockfetcher 980 posts msg #116684 |
11/12/2013 6:12:45 AM Hi, Thank you for the feedback. It looks like you are comparing a chart on stockcharts using a Log scale vs a linear scale on StockFetcher: If you change the scale to logarithmic on StockFetcher (see the settings page), the comparison would be more apples to apples: 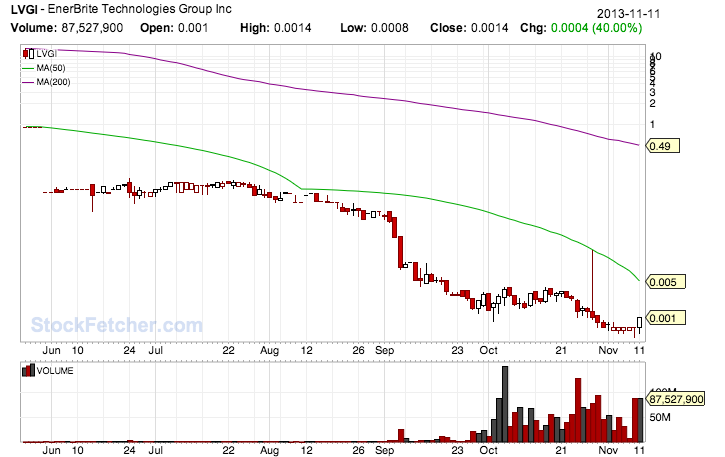 One point of difference, stockcharts does drop indicators that are out of view (in this case the ma(200)). We can look into an option to do this automatically but given all indicators are considered important as they might be directly involved in the filtering criteria such as "close more than 30 percent below ma(200)" we prefer to leave them on. What you can do with the new html5 charts is click on the legend key to toggle this visibility - in this case by clicking on ma(200) your chart will line up closer to stockchart's: 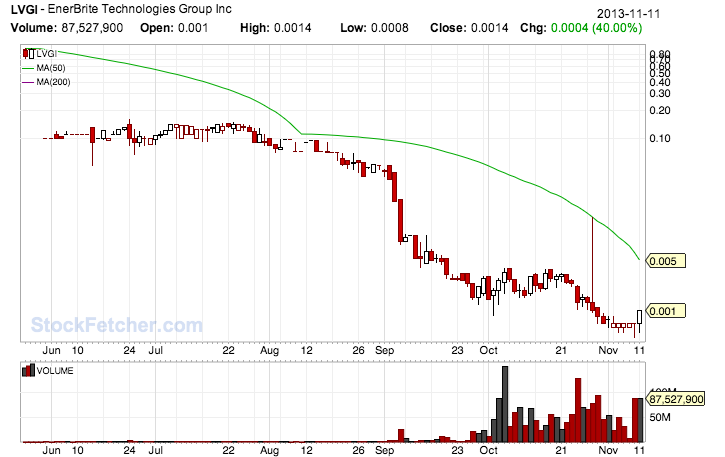 |
| BuffaloBill 17 posts msg #116750 - Ignore BuffaloBill |
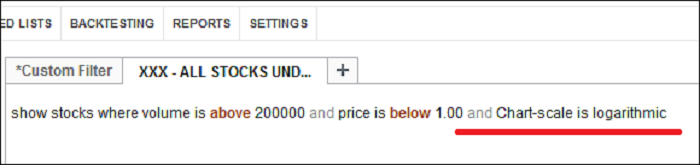
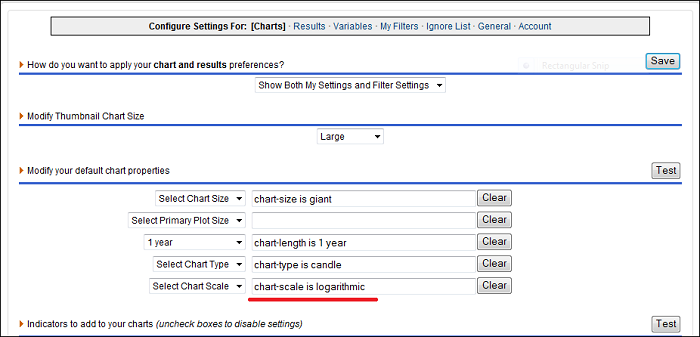
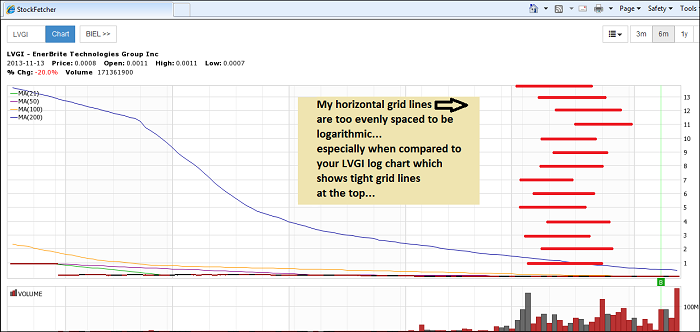
11/14/2013 1:51:23 AM Hi, Thanks for the quick reply. Apparently, I'm not able to produce logarithmic charts. "... It looks like you are comparing a chart on stockcharts using a Log scale vs a linear scale on StockFetcher: If you change the scale to logarithmic on StockFetcher (see the settings page), the comparison would be more apples to apples:" I did have my SF chart-scaling set to logarithmic (as mentioned in my last post) - both charts were set to logarithmic. Unfortunately my SF chart displayed as linear. The log-scale setting seems to be the problem. Your LVGI chart was definitely log scale. Mine was linear with none of the compressed, horizontal grid-lines at the top like your chart. If you can get those charts, and I can't, then my scale setting must not be working correctly. I tried toggling the scale settings - linear works, log doesn't. I rebooted after each setting change. Tried different chart sizes and lengths. Then I tried adding the phrase "and Chart-scale is logarithmic" to the filter - no luckl. My charts always display as linear, not log. I'd appreciate any thoughts you have. Bill These images are from Wednesday afternoon. My Filter with added logarithmic phrase: |
| stockfetcher 980 posts msg #116751 |
11/14/2013 7:56:12 AM Thank you for the additional details. It appears that your browser does not fully support HTML5. When this happens, StockFetcher falls back to a less-featured, static chart. At this time, those charts do not support log-scale; however, we will look into that issue. If possible, can you try a different internet browser (Google Chrome, Firefox, etc) to verify that you are able to view the HTML5 charts which do support the log-scaling. Thank you, StockFetcher Support |
| BuffaloBill 17 posts msg #116772 - Ignore BuffaloBill |
11/14/2013 8:01:08 PM I installed Chrome and all is well.... Thanks again for your help. Bill |
| StockFetcher Forums · General Discussion · Help... sub-penny stocks not displaying correctly | << >>Post Follow-up |