| StockFetcher Forums · General Discussion · Interesting Book to read Daryl Guppy Trend trading | << 1 2 3 4 5 ... 11 >>Post Follow-up |
| pthomas215 1,251 posts msg #134897 - Ignore pthomas215 |
3/13/2017 12:33:22 PM John, correct. I am thinking of it as short term averages crossing over longer term is a buy signal. that may be too linear thinking, as you suggest the ema(60) moving indicates a bullish trend. |
| graftonian 1,089 posts msg #134898 - Ignore graftonian |
3/13/2017 1:18:45 PM Mac, what filter are you using to to obtain a "long list" of stocks? Do you use a count back line to pick an entry after the selection process is complete? Thanx, Duane |
| Mactheriverrat 3,178 posts msg #134899 - Ignore Mactheriverrat |
3/13/2017 1:20:24 PM Yes short term averages crossing over longer term is a buy but trend should be confirmed. Price should be crossing above a downtrend line. See pages 110 to 133 of Guppys book |
| Mactheriverrat 3,178 posts msg #134901 - Ignore Mactheriverrat modified |
3/13/2017 3:06:55 PM @graf I'm using a Price above ema(30) filter. ema(13) is above ema(30) adr(30) above 2.50 volume above 200000 Market in not otcbb still playing around with filter One could adapt this to just about any filter- I'm playing around with Run Forest, Run filter. The key is finding the best up trending stocks using part one of Guppys finding good trending stocks I played AMD today and still in 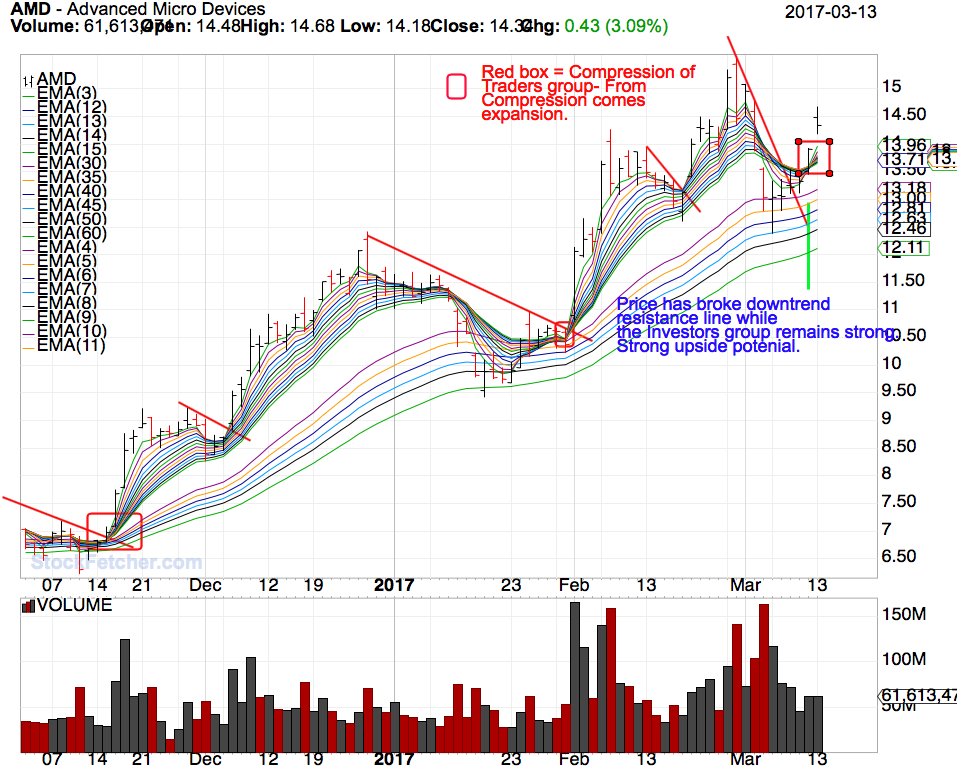 XIV is a prime example chart IMHO 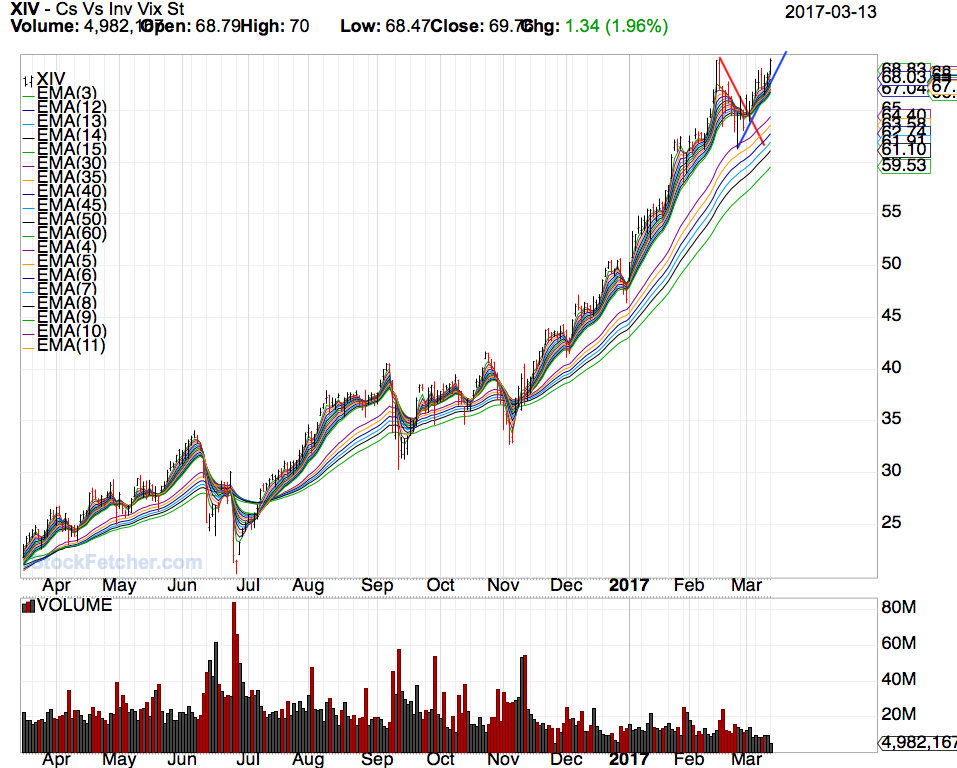 |
| graftonian 1,089 posts msg #134906 - Ignore graftonian |
3/13/2017 7:19:36 PM Mac, I considered AMD this morning but thought it opened a little high. I hate gaps. PG was another stock on the radar, but didn't quite make it to the CBL entry (91.50). Looks like our old friends (enemies?) NUGT and JNUG are picking up steam. I guess we wait and see if the traders can make it through the investors; only time will tell. I have also added trader width, investor width, and trader/investor aeparation to my GMMA filter. Will share when I have a "real" computer back. My monitor shot craps, and I'm down to working on a tablet. Cannot figure out how to cut and paste. |
| Mactheriverrat 3,178 posts msg #134907 - Ignore Mactheriverrat |
3/13/2017 7:35:54 PM Roger Graf |
| graftonian 1,089 posts msg #134908 - Ignore graftonian |
3/13/2017 8:46:04 PM Well, here's the new and improved.. Down at the bottom, in the area labled /*FILTER*/ one can fiddle with short term score, long term score, band widths, et al , and get it to pull up results all across the spectrum. Have fun. |
| T_Charp13 35 posts msg #134909 - Ignore T_Charp13 |
3/13/2017 10:03:27 PM Any particular reason why you chose to filter stocks between .5 and 10? |
| graftonian 1,089 posts msg #134911 - Ignore graftonian |
3/14/2017 12:20:08 AM Nope, oops |
| Mactheriverrat 3,178 posts msg #134912 - Ignore Mactheriverrat modified |
3/14/2017 1:20:17 AM Now that's Interesting Graf! |
| StockFetcher Forums · General Discussion · Interesting Book to read Daryl Guppy Trend trading | << 1 2 3 4 5 ... 11 >>Post Follow-up |