| StockFetcher Forums · General Discussion · Interesting Book to read Daryl Guppy Trend trading | << 1 ... 3 4 5 6 7 ... 11 >>Post Follow-up |
| Mactheriverrat 3,178 posts msg #134996 - Ignore Mactheriverrat modified |
3/18/2017 11:55:02 AM @ T_charp If the price has reach the EMA(21) area it has already broken the uptrend trend line. I myself use a close of the EMA(9). If price re-mounts above the EMA(9) chance's are price will extend the uptrend. Look at PVG first leg up what happens when trend line is broken at the top . Price breaks trend line, then price makes a close below EMA(9), then everything goes to hell. Price did close below ema(9) about late January so one could have got out then from getting in late December . That would have been a nice gain. PVG is a good buy in point now again. 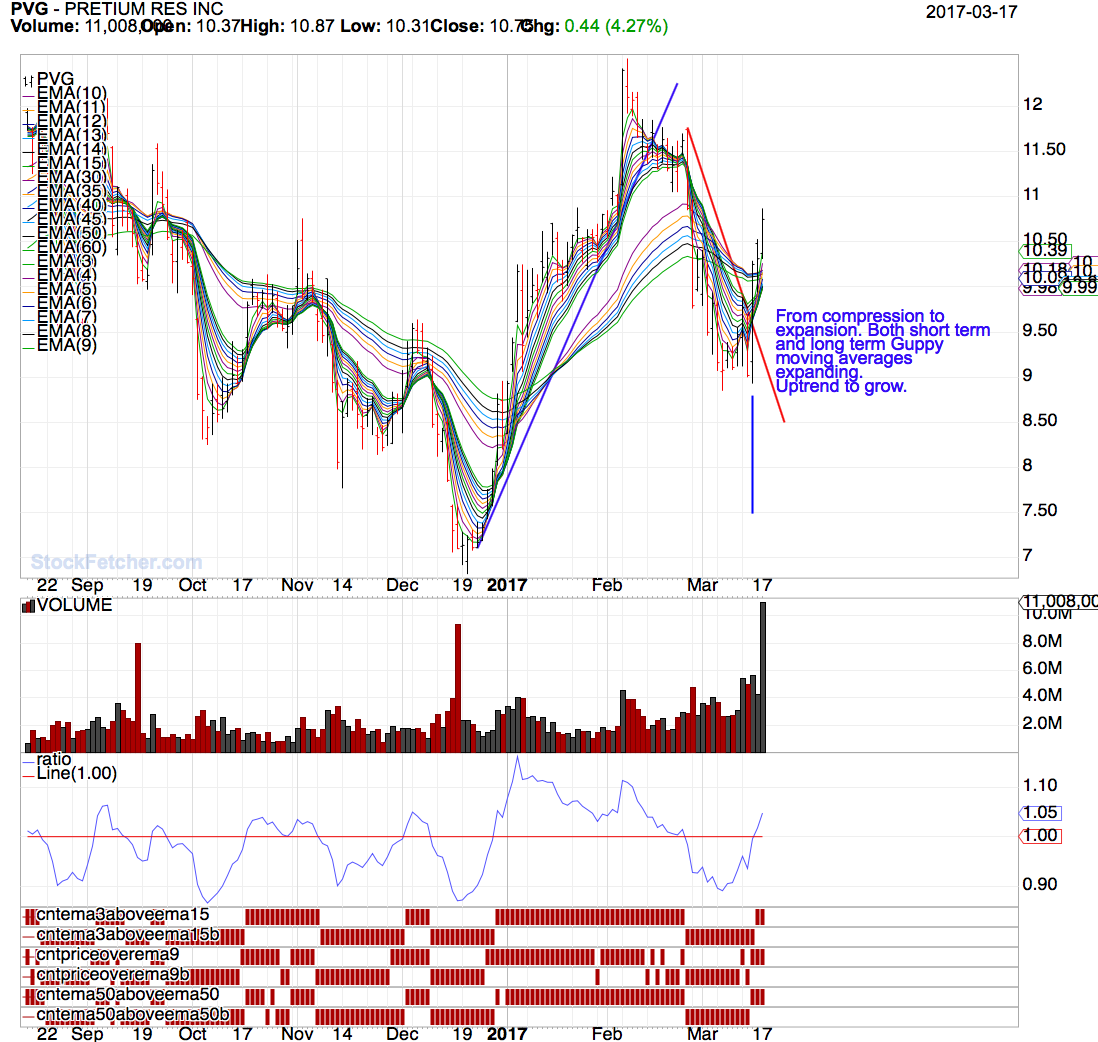 |
| Mactheriverrat 3,178 posts msg #134998 - Ignore Mactheriverrat modified |
3/19/2017 1:43:32 PM Finding the Trader group smallest compression area is 1.00 . From compression comes expansion. Ratio showing a cross above show that area. Submit |
| davesaint86 726 posts msg #135001 - Ignore davesaint86 |
3/19/2017 5:53:23 PM Look's good Mactheriverrat! I saved and changed the chart to a weekly. It looks like this will work well with my 401k. Dave |
| mahkoh 1,065 posts msg #135017 - Ignore mahkoh modified |
3/20/2017 4:54:49 PM Maybe.. |
| graftonian 1,089 posts msg #135036 - Ignore graftonian modified |
3/21/2017 2:28:17 PM Mac, A couple of questions. 1) Why did Guppy add the section on Darvas Box? 2) Do you think we are in for a downtrend? XLV and XLK probably will stop out today, so I am back to cash. Applying MMA's to the spider sectors yields an interesting picture, in that the only sectors (and they are not really sectors) showing any promise are AGG, SH and SPXU. I am sitting on the fence, wondering which way the wind will blow |
| four 5,087 posts msg #135111 - Ignore four modified |
3/24/2017 5:06:56 PM Just "bumped" into this... https://wishingwealthblog.com/category/my-favorite-posts/ Another approach I like to use is an adaptation of the 12 exponential moving averages that Australian technical analyst Daryl Guppy uses. His GMMA (Guppy multiple moving averages) plots the following weekly moving averages (six short averages 3,5,8,10,12,15 and 6 longer term averages 30,35,40,45,50,60). -- https://videos.worden.com/webinars/DrEricWish041310.html |
| Mactheriverrat 3,178 posts msg #135126 - Ignore Mactheriverrat |
3/25/2017 1:22:49 PM @ graft XLK - Weakness watch for re-mount of ema(9) 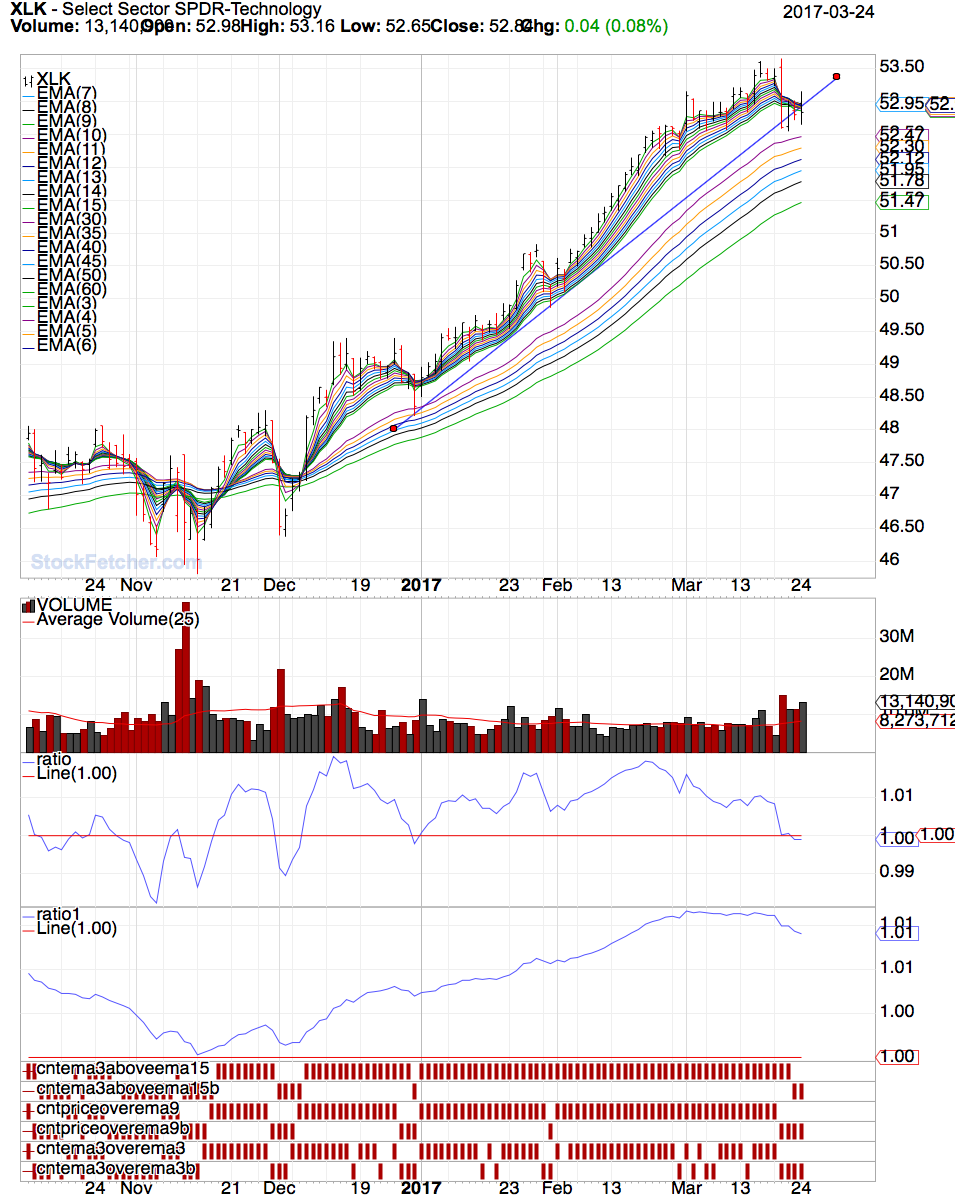 SPXU - very weak push for trend change. 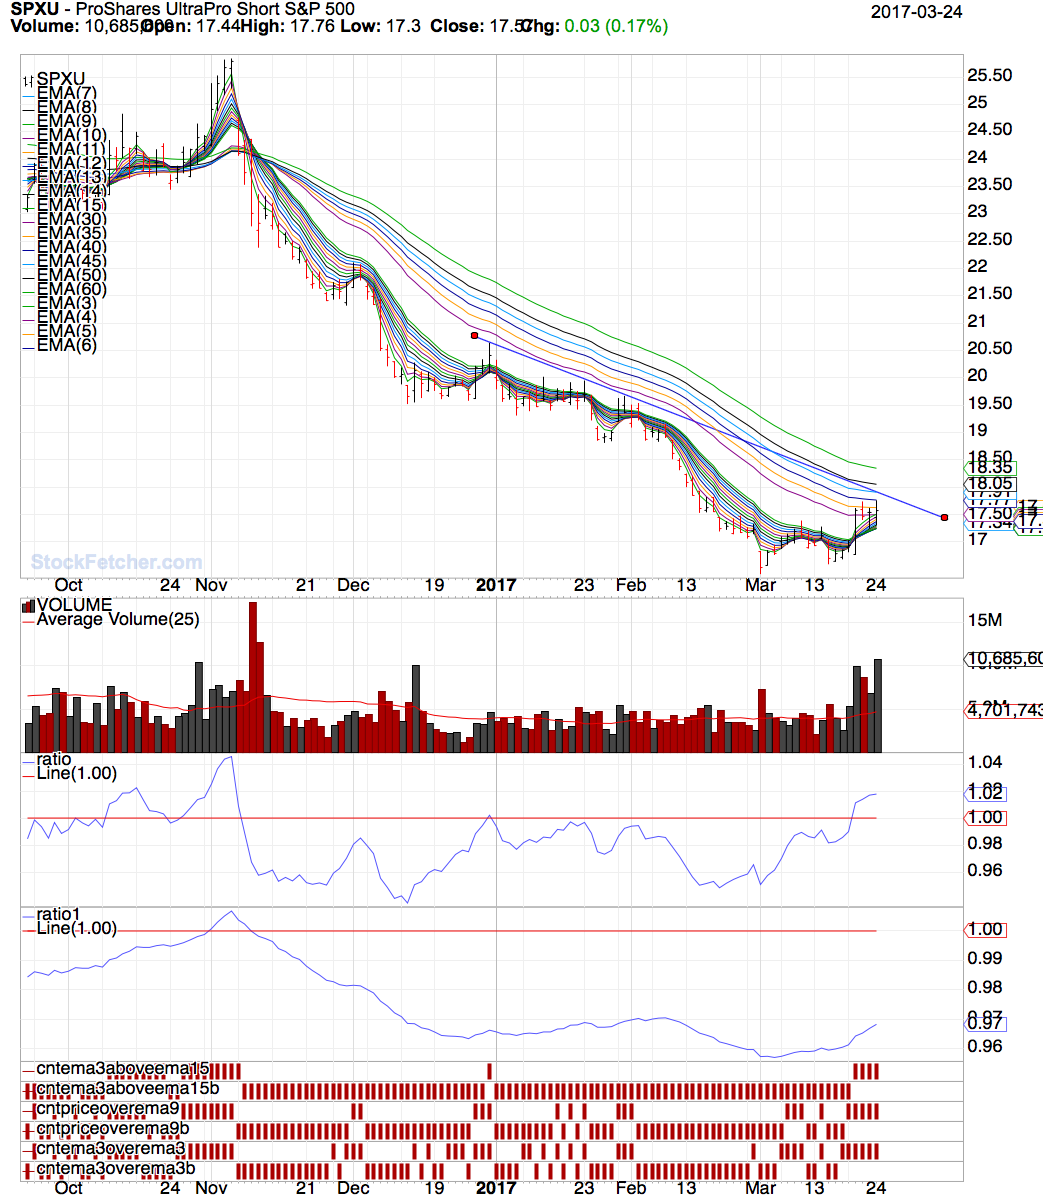 XLV - Out already 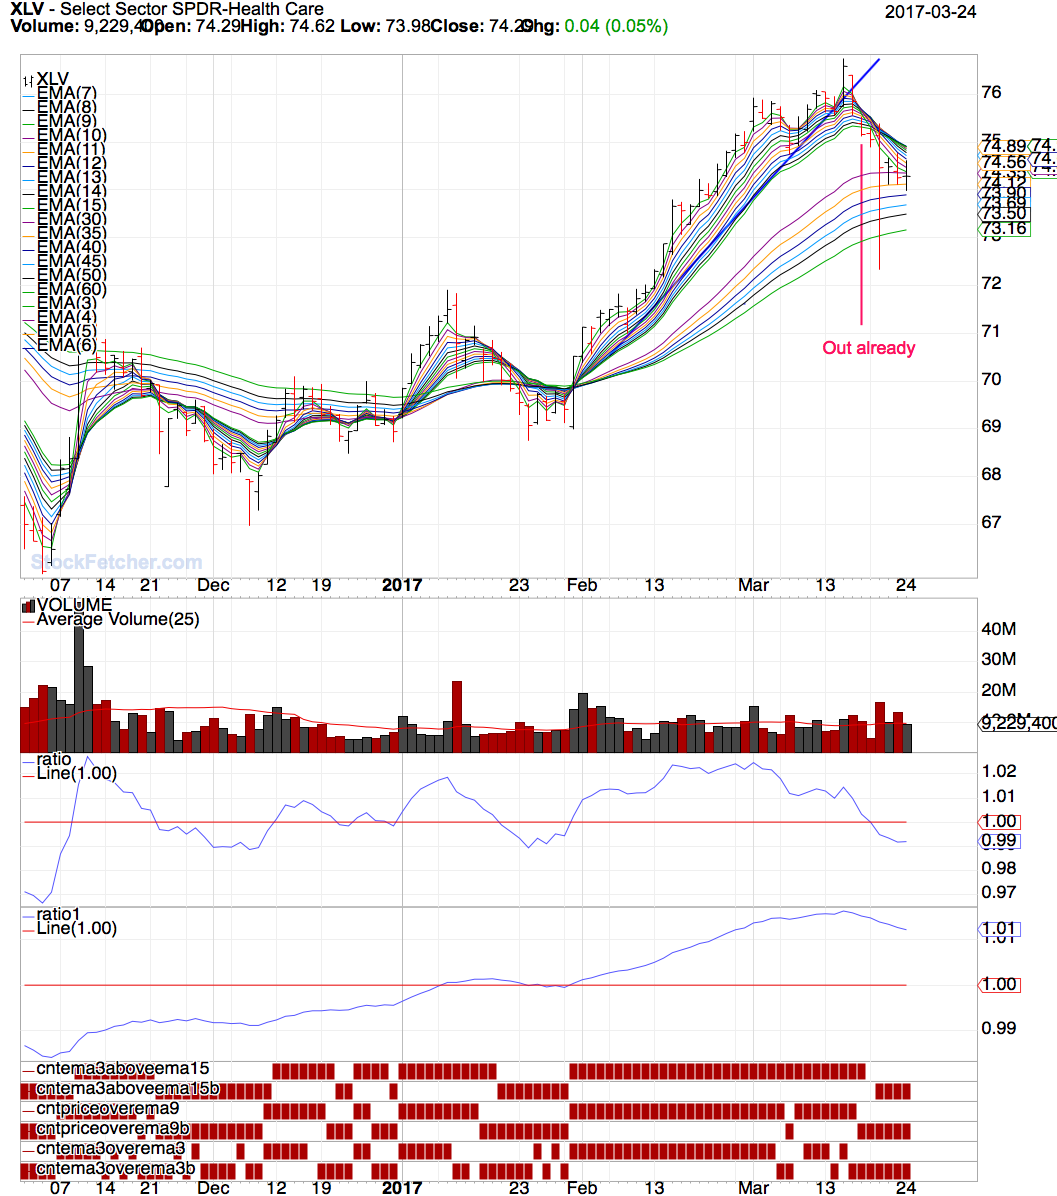 AGG - Side ways movement - No trend! SH - Like SPXU - very weak push for trend change. 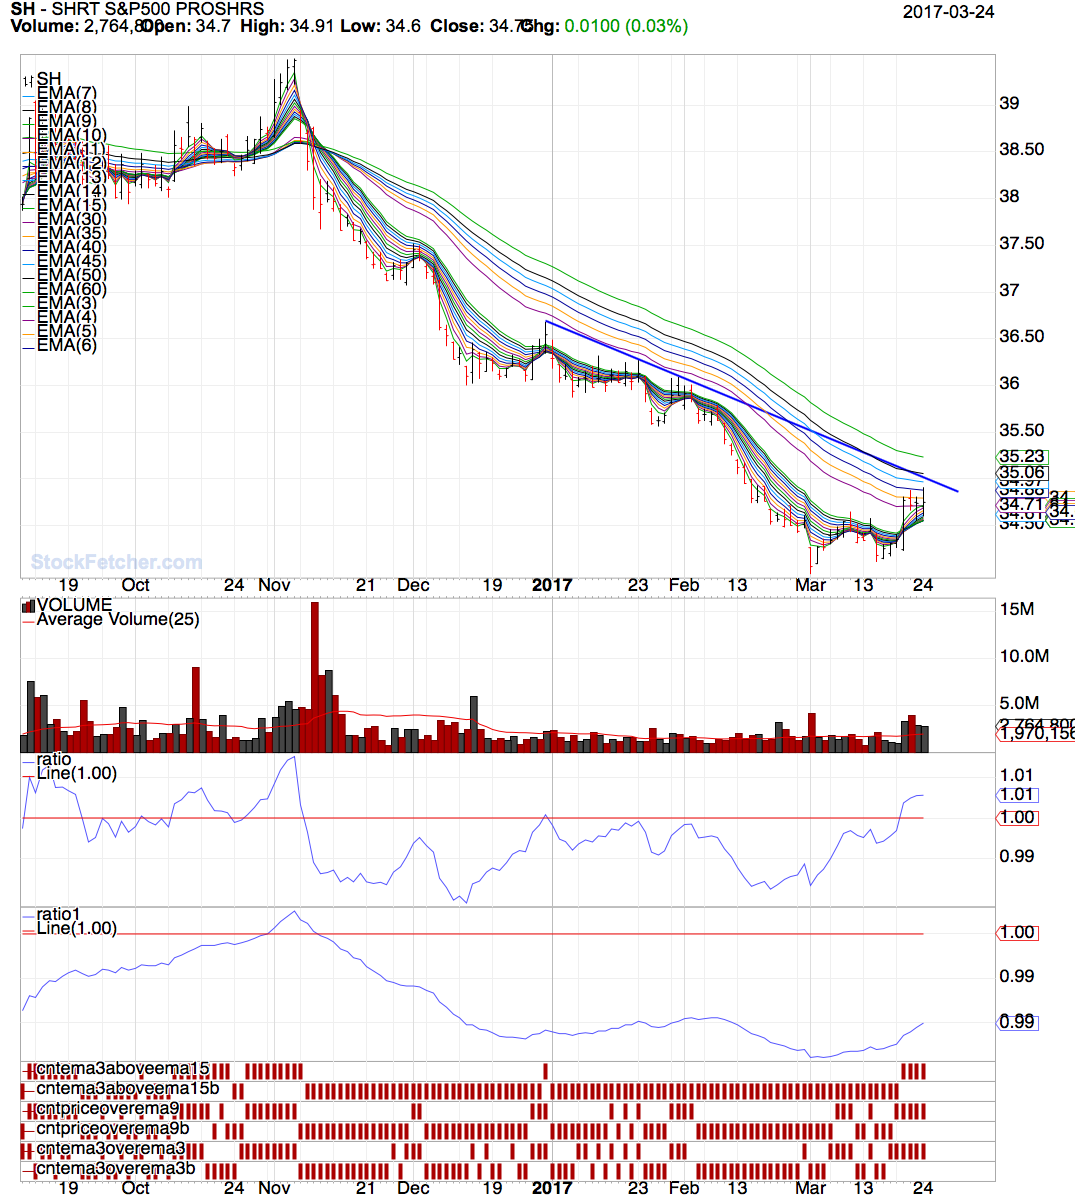 |
| Mactheriverrat 3,178 posts msg #135127 - Ignore Mactheriverrat modified |
3/25/2017 1:34:59 PM @four Nice links I will have to download some 3rd party software as Apple's Quick time software won't open .wmv movies. QQQ like graft's XLK which are showing weakness from the traders group " ema(3) to ema(15) " the Investors group " ema(30) to ema(60) " are showing very little compression at all. I myself would wait for a re-mount of price above the ema(9) on QQQ 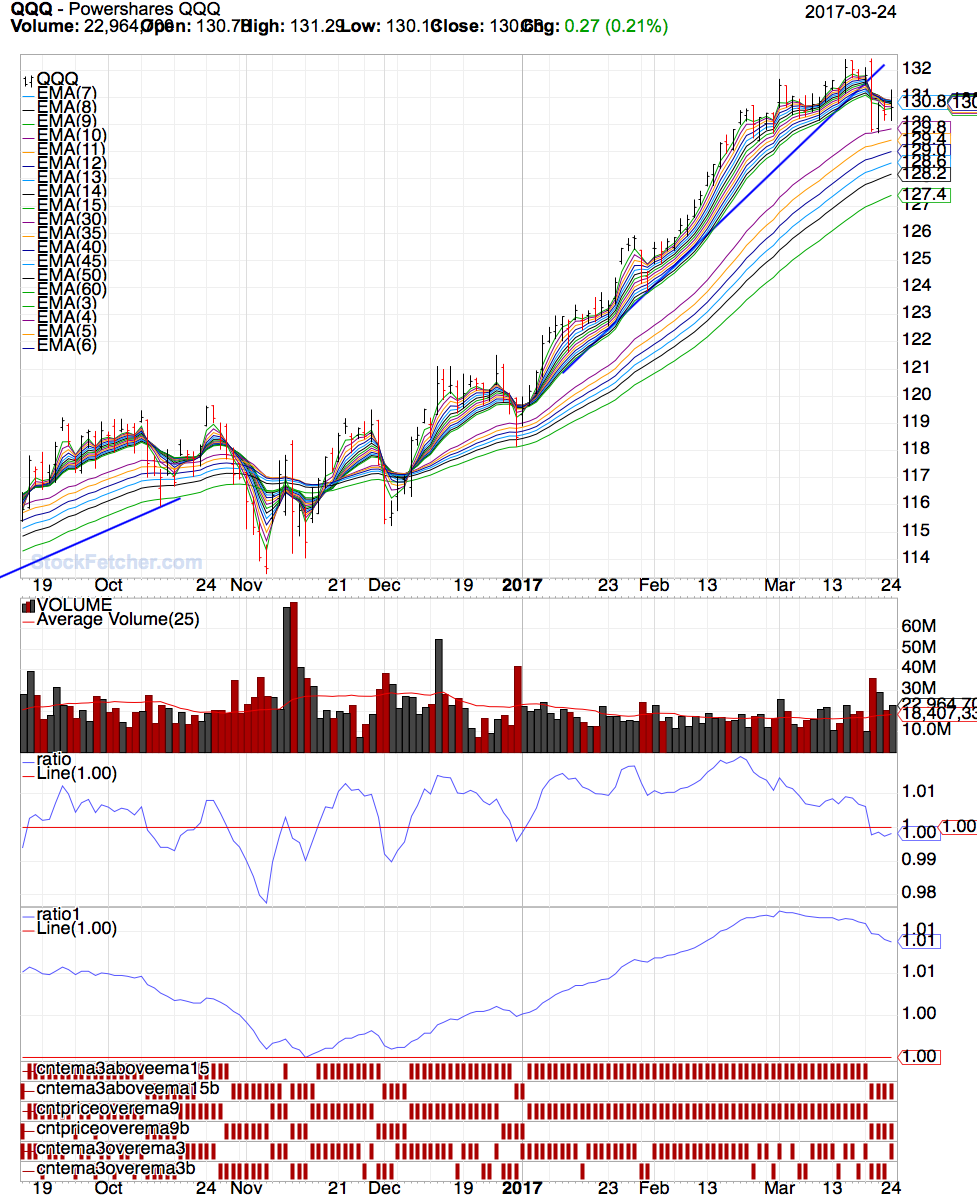 BTW- my ratio's are the first one is a ema(3) to ema(15) and second one is ema(30) to ema(50) --------------- set{ratio, eMa(3)/ eMa(15) one day ago } and add column ratio and add column ratio one day ago and add column ratio two day ago draw ratio line at 1.00 set{ratio1, eMa(30)/ eMa(50) one day ago } and add column ratio1 and add column ratio1 one day ago and add column ratio1 two day ago draw ratio1 line at 1.00 |
| nibor100 1,103 posts msg #135286 - Ignore nibor100 |
4/5/2017 5:17:48 PM @Mactheriverrat, On the weekend of Mar 12th you posted charts of AMD, and BAC as examples of the long term averages strength and strong potential upside. AMD has pretty much gone sideways since then and BAC took a turn down. Using StockFetchers "similar chart" utility I found some other examples, which I've identified in the symbol list below, Some of these go sideways like AMD, others down like BAC and others go up as expected. While I like the Guppy MMAs I've always run into this situation where the stock can break in any direction no matter how strong the prevailing longer term averages look. I know you posted several times that all is needed is GMMA and a trend line but it looks to me that another indicator or two could be helpful.... Thanks, Ed S. |
| Mactheriverrat 3,178 posts msg #135290 - Ignore Mactheriverrat modified |
4/6/2017 12:52:16 AM Side ways isn't always bad as long as the long term group doesn't compress . Price falls below the ema(15) one should use caution and really watch the longer term group. BAC is a prime example. 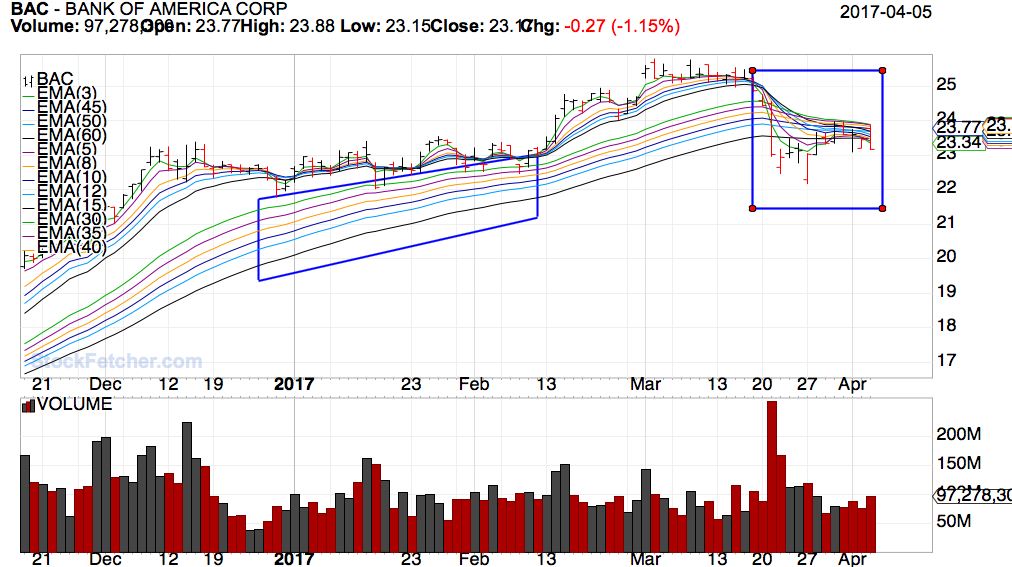 Now AMD is still Bullish and still can make another run up . It just has to breakout above the ascending triangle. The markets that were like today where AMD was up near the top of the ascending triangle but the markets sold off like air out of a flat tire. I'm still in as AMD range is in a tight trading range. 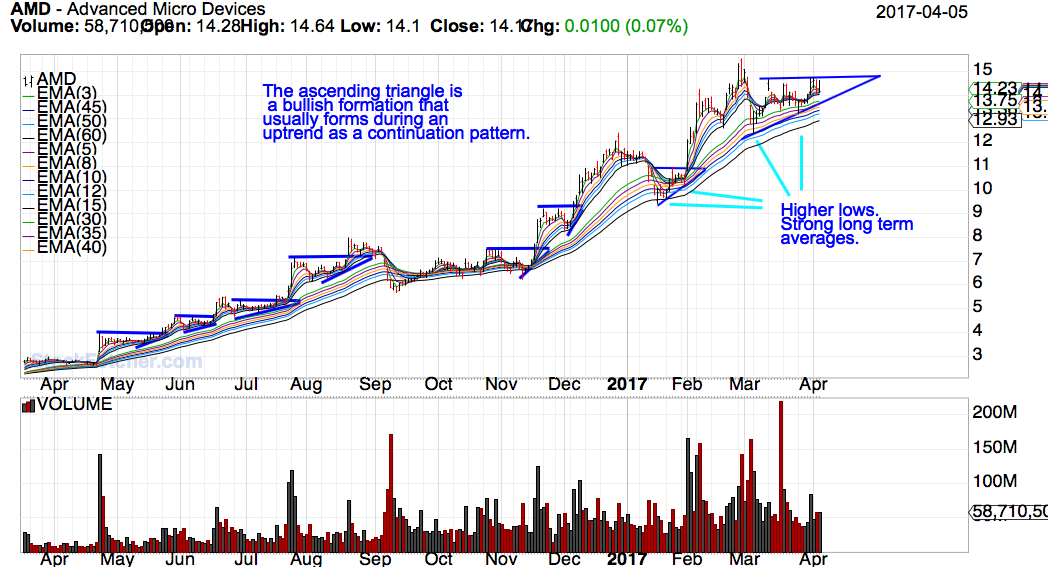 |
| StockFetcher Forums · General Discussion · Interesting Book to read Daryl Guppy Trend trading | << 1 ... 3 4 5 6 7 ... 11 >>Post Follow-up |