| StockFetcher Forums · General Discussion · SF ... Parabolic SAR color plot ... | << 1 2 >>Post Follow-up |
| alf44 2,025 posts msg #117215 - Ignore alf44 |
12/4/2013 7:03:39 PM . Would it be possible to have the Parabolic SAR indicator plot ... "GREEN BELOW" ... "RED ABOVE" ... the price action ? TIA . |
| Kevin_in_GA 4,599 posts msg #117217 - Ignore Kevin_in_GA |
12/4/2013 7:32:16 PM Same goes for a lot of indicators (e.g., the color of the MACD Histogram, or a user-defined variable plotted as a dot using the PLOTTYPE{} command). |
| alf44 2,025 posts msg #117218 - Ignore alf44 modified |
12/4/2013 8:39:08 PM . ... heck, to be able to define your own colors for Moving Averages (or, ANY indicator plot) would be REALLY helpful ! imo ----- PS. Thanks, Kevin ... didn't even know the "Plot Type" feature existed ! LOL . |
| alf44 2,025 posts msg #117219 - Ignore alf44 |
12/4/2013 8:45:12 PM . ... but, StockFetcher ... can we start with the above Parabolic SAR request FIRST ? TYVM . |
| stockfetcher 980 posts msg #117225 |
12/4/2013 10:02:41 PM We are currently working on a chart color and type editor that should help do exactly what you are looking for. Thank you, StockFetcher Support |
| stockfetcher 980 posts msg #117242 |
12/5/2013 3:48:19 PM Alf44, Is the following what you were thinking? 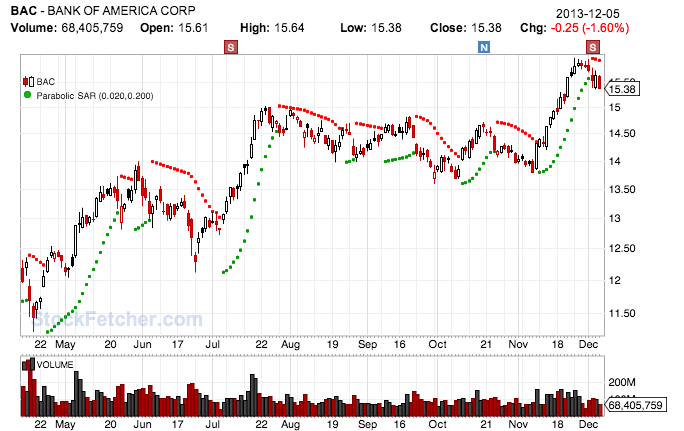 We just wanted to confirm before we get too far on this one. Thanks, StockFetcher.com Support |
| alf44 2,025 posts msg #117243 - Ignore alf44 |
12/5/2013 4:02:07 PM . ... at first blush, it looks great ! Can't wait to use it ! . |
| alf44 2,025 posts msg #117244 - Ignore alf44 modified |
12/5/2013 8:55:19 PM . ...okay, so a quick concern/question ! First ... IT LOOKS NICE ... with the default parameters of the indicator !!! REALLY NICE !!! imo ----- NOW ... here's the problem ... ... when I choose to display the Parabolic SAR indicator ... with ANYTHING OTHER than the default parameter "MIN/MAX step increments" (0.02, 0.20) ... the chart never "loads" ... EVER !!! It just sits there ... forever ... "loading" ... BUT NEVER DOES !!! So ... can "we" please address this ? ----- As is ... it doesn't seem to allow the ability to adjust the indicator's sensitivity parameters by tweeking the "step increments" ... ... and then ... to have that be properly displayed in a chart representation ! Or, even displayed AT ALL !!! That is VERY problematic ... for my particular use !!! PLEASE FIX !!! TIA . |
| Kevin_in_GA 4,599 posts msg #117246 - Ignore Kevin_in_GA |
12/5/2013 10:24:07 PM Seems to be working for me. |
| alf44 2,025 posts msg #117247 - Ignore alf44 modified |
12/5/2013 10:41:31 PM . I think I isolated the issue ... --- Kevin, try this (then try to pull up a BAC chart) ... NOTHING !!! ----- NOW ... try this (then try to pull up a BAC chart) ... ------ There seems to be an "aversion" ... with Custom "Exponential" MAs (of the ASI) ... And ... a "love" ... with Custom "Simple" MAs (of the ASI) ... Or, am I crazy ??? . |
| StockFetcher Forums · General Discussion · SF ... Parabolic SAR color plot ... | << 1 2 >>Post Follow-up |