| StockFetcher Forums · General Discussion · StockFetcher ... can this feature be added ? | << 1 2 3 4 >>Post Follow-up |
| alf44 2,025 posts msg #116907 - Ignore alf44 modified |
11/20/2013 10:10:23 PM . "assuming the Market is in a current DOWN MOVE" ... "assuming the Market is in a current UP MOVE" ... !!! ----- Therein lies ... the first snag ! This HAS to be defined ! But how ? ----- It is one thing to "manually" LOOK at a chart and make that assessment ... based on one's own perception and cognitive thinking ... * (Stowell originally drew these lines by hand ... on his own charts ... a fairly simple exercise ... for a HUMAN) ! It is an altogether "nuther" thing ... to somehow try and "define" AND "automate" what you see (or, think you see) ... and then represent it accurately (and graphically) on a chart ! ----- To try and DEFINE it ... in a way that can be precisely represented ... in an automated way and then drawn on a chart ... appears to be a bit easier said than done ! Let's not forget ... this is NOT a LONG TERM TREND indicator ... AT ALL !!! It is more intended (at least the way I interpret it) to be a SHORT to INTERMEDIATE TERM TREND and VOLATILITY indicator ! . |
| alf44 2,025 posts msg #116909 - Ignore alf44 modified |
11/20/2013 10:40:48 PM "SAFeTRADE" ... I need some more time to look at this last ... "Another stab at it" scan ... you dun jist posted ... but ... at first glance, pretty impressed !!! ----- While it doesn't actually achieve the desired goal of this thread (to create a visual 3 Bar Net Line "drawn" on the price plot) ... ... it is very clever ! NICE WORK !!! IMO . |
| SAFeTRADE 660 posts msg #116914 - Ignore SAFeTRADE modified |
11/21/2013 12:11:38 AM Thanks ALF44, I have plotted the price lines in this filter. I think this is the best I can do, don't know how to check for inside days and make them part of the scan. I think he defines the trend in the two pages I posted at the bottom of each page. In a Three Bar Net Line - Down Trend: Line 8. As long as the market does not close above this trend line, the trend is down. In a Three Bar Net Line - Up Trend: Line 8. As long as the market does not close below this trend line, the trend is up |
| SAFeTRADE 660 posts msg #116932 - Ignore SAFeTRADE modified |
11/21/2013 9:36:28 AM Cleaner chart and added columns of informational criteria. ALF you have, I remember the code for inside days. May want to look for how to incorporate that into filter. I will search for that thread. I only have standard subscription so might be too much code to add it. |
| SAFeTRADE 660 posts msg #116933 - Ignore SAFeTRADE modified |
11/21/2013 10:24:37 AM Found your code for ID's. This is as far as I could get before filter restrictions set in. Trying to account for ID's excluding an ID today. Maybe you can take it further. Maybe idyes has to check 6 days back to account for an ID today? /* IDs (Inside Days -> H/L range inside H/L range 1 day ago) */ set{IDhi, count(High below High 1 day ago, 1)} set{IDlo, count(Low above Low 1 day ago, 1)} set{ID, IDhi * IDlo} set{idyes, days(id equal 0,5)} set{id2day, count(id > 0,1)} set{havehad, idyes - id2day} set{accountforid, count(havehad > 0,1)} |
| SAFeTRADE 660 posts msg #116936 - Ignore SAFeTRADE modified |
11/21/2013 11:34:35 AM Here is one using Parabolic Sar and RSI(2) Buy on Buy signal and RSI(2) > 80 and Sell on Sell signal and RSI(2) below 30. Still no inside day though. Using Parabolic sar to define trend. |
| alf44 2,025 posts msg #116951 - Ignore alf44 modified |
11/21/2013 9:09:02 PM . HOPE that this thread can somehow ... get back on track !!! ----- The purpose of the "OP" (original post) was to encourage the SF crew to try and implement this "3 Bar Net Line" feature into the SF "toolbox" !!! THAT "implementation" ... the one I envisioned when this thread was created ... is a "graphical representation" of the "3 Bar Net Line" ... ON THE PRICE PLOT !!! ----- I HOPE that SF ... will continue with the great effort they have ALREADY made ... toward that end !!! ----- Meanwhile ... I encourage input from others here at SF (many of whom are WAAAY more clever than I) ... BUT ... BUT ... can we at least FOCUS THAT INPUT ... on the stated goal of the ORIGINAL POST ??? ----- THAT IS ... offer INPUT ... not necessarily copious scans / filters you think may or may not "approximate" the goal of the OP ... but ... but ... INPUT to ... AND ... ENCOURAGEMENT to ... the SF crew ... ... to continue to try and implement an accurate "graphical representation" of the "3 Bar Net Line" ... ON THE PRICE PLOT !!! TYVM ! . |
| SAFeTRADE 660 posts msg #116973 - Ignore SAFeTRADE modified |
11/22/2013 11:21:46 AM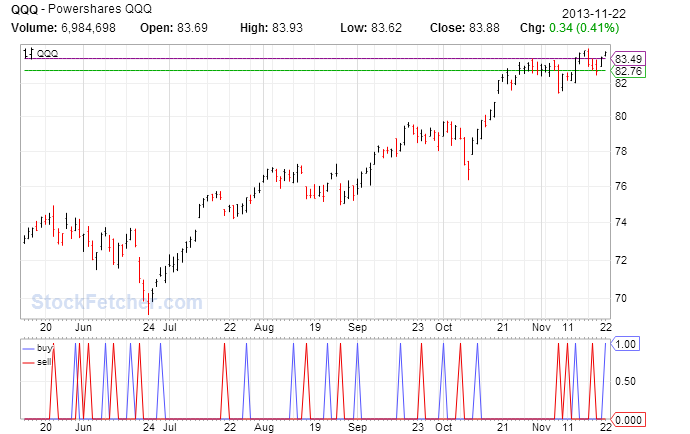 ALF44, this is as stripped down as it gets. Stockfetcher why aren't the two lines labeled in the top left hand corner. They used to be. It gets quite confusing when there is more than 1 line or indicator being drawn. draw price line at low 3 days ago draw price line at high 3 days ago set{buy, count(close Crossed above high 3 days ago,1)} set{sell, count(close crossed below low 3 days ago,1)} symlist(spy) draw sell on plot buy Hey, ALF44.....Check out visual of the close as it relates to the low 3 days ago on the chart below. Hope my continuing effort at this doesn't get you.....more.....aggravated. But I thought it looked ....cool! 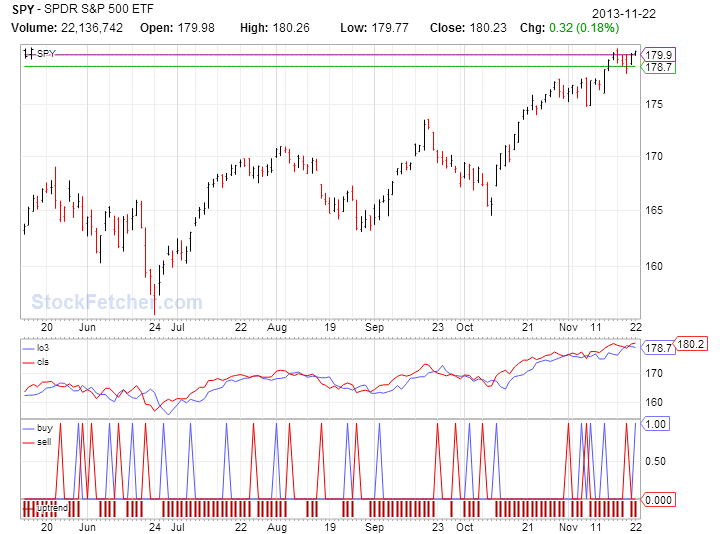 |
| alf44 2,025 posts msg #117159 - Ignore alf44 modified |
12/2/2013 4:18:50 PM . ... Nirvana's Omnitrader software apparently is able to define, construct and display "3 Bar Net Lines" ! They are a slight variation of Joe Stowell's original "3 BNLs" ... and, are created by Daryl Guppy ... and, are called "Count Back Lines" ! Nevertheless ... StockFetcher ... THIS IS DOABLE !!! --- Copy and Paste this : http://omnitrader.com/PDFs/GMMA2.pdf ... into your browser to read MORE about them ... . |
| alf44 2,025 posts msg #117163 - Ignore alf44 modified |
12/2/2013 9:11:29 PM . StockFetcher ... have "we" given up on the implementation of this "feature" ??? Or, at least ... a reasonable facsimile of IT !!! --- It seems the initial enthusiasm has ... uhhh ... well ... subsided !!! 
. |
| StockFetcher Forums · General Discussion · StockFetcher ... can this feature be added ? | << 1 2 3 4 >>Post Follow-up |