| StockFetcher Forums · General Discussion · StockFetcher ... can this feature be added ? | << 1 2 3 4 >>Post Follow-up |
| SAFeTRADE 660 posts msg #116882 - Ignore SAFeTRADE modified |
11/20/2013 9:39:45 AM 1-Use ALF's 4 above 3 as an early warning of an impending change or buy the signal...or... 2- buy at the cross of the green line above the red line. 3- sell at the cross of the green line below 150....or... 4-sell at the sell signal Or make your own rules. |
| alf44 2,025 posts msg #116883 - Ignore alf44 modified |
11/20/2013 10:21:02 AM . ... what is "column dayr20" and where is it ? ( and "line100" ? ) ----- Trying to completely understand this ... . |
| stockfetcher 980 posts msg #116885 |
11/20/2013 11:14:54 AM We are currently working on a version of the Three Bar Net Line as you described. Ultimately, we would want this to appear and behave like the Parabolic SAR, where the measure is above or below the current price at any time based on the prevailing rising or falling trend. Additionally, we would want to identify price breaks where the Three Bar Net Line changes trend. Below is an illustration that brings up a question on how to identify the prevailing trend. If we apply the rules from your initial description, both the rising and falling trend conditions could be met simultaneously. 
We'll continue to work on this pattern and hopefully have a version for testing. StockFetcher Support |
| Kevin_in_GA 4,599 posts msg #116886 - Ignore Kevin_in_GA modified |
11/20/2013 12:47:58 PM Which in and of itself may be useful. It may be helpful in identifying stocks that are trending within a tight range ahead of a breakout, similar to (or in conjunction with) other volatility compression strategies. |
| alf44 2,025 posts msg #116891 - Ignore alf44 modified |
11/20/2013 1:44:34 PM . This would be MY assessment of the AAPL chart ... had I started back on Sept. 16 ... at that pivot LOW ... and worked forward (manually) to present. The GREEN circles show the price bars that either changed trend direction or made a higher high and therefore a redrawn line. Obviously, the RED circles show the price bars that either changed trend direction or made a lower low and therefore a redrawn line. --- 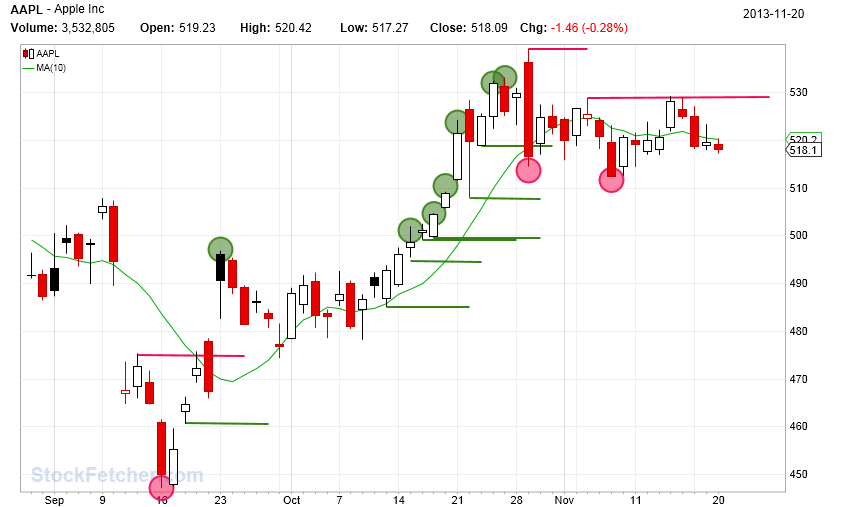 --- It gets a little tricky when we see that big RED candle on Oct. 29 ... it is both the pivot HIGH and it's LOW Close breaks the most recent UP 3 Bar Net Line ... changing the trend from UP to DOWN. You can't really count back to the left to find bars 2 & 3 because it's such a large range day it engulfs the previous days candles. I just made the HIGH of that big RED candle my DOWN 3 Bar Net Line ... and then waited for a LOWER LOW to be made for the next DOWN 3 Bar Net Line to be drawn ... and it was ... and since no CLOSE above that most recent RED line has been made the "TREND is DOWN". (although in reality AAPL is for the most part trading sideways within the range of that BIG RED candle) --- You raise a good point about determining the "current trend" ... and from where do you start counting backwards. I mentioned above the importance I place on the recent "pivot" Highs and Lows ... and of having them be my "1" day and counting back from there. It's kind'of a dilemma ! --- NOW ... if you begin with the current candle ( ie. Today) ... look left ... find the most recent "pivot" ... ... make THAT candle #1 ... ... look left again ... find the next candle with a LOWER LOW ... make THAT candle #2 ... ... look left again ... find the next candle with a LOWER LOW ... make THAT candle #3 ... ... draw your 3 Bar Net Line at the LOW of #3 ... ----- 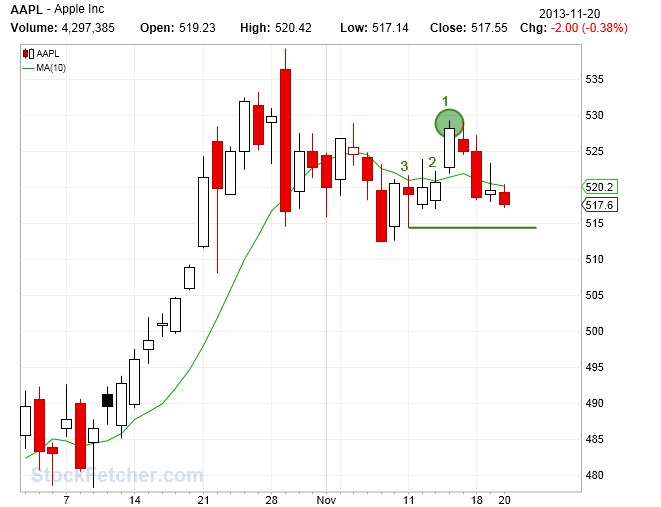 ----- The "TREND is UP" !!! . |
| stockfetcher 980 posts msg #116896 |
11/20/2013 3:10:18 PM Thank you for the follow-up and additional thoughts on this feature. We've included two examples below to hopefully further generate ideas on refining the automated process for detecting these patterns. 1. Parabolic SAR-style: This method attempts to produce a prevailing trend, starting from the most recent data point. 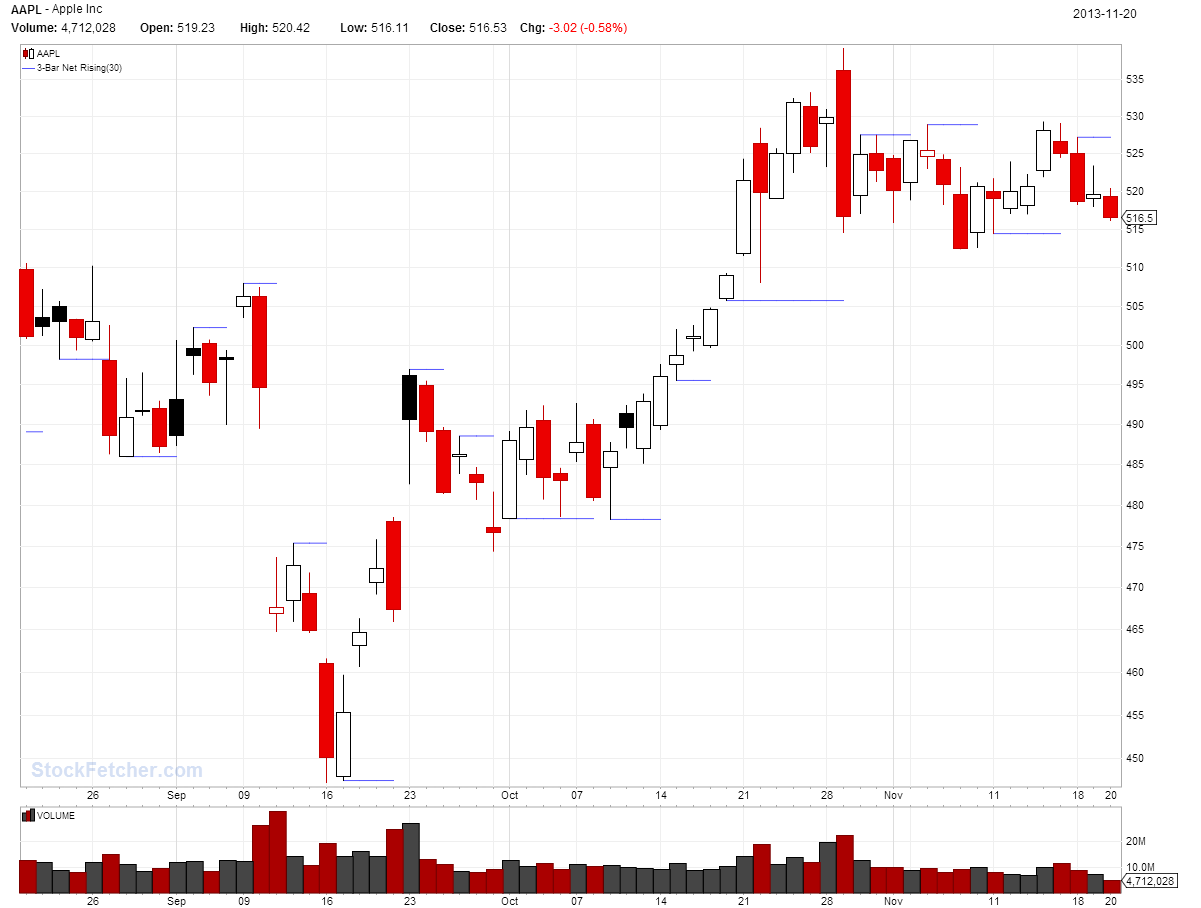 2. Independent Trends: In this image, the approach is that both the detection for the "Rising" and "Falling" patterns are applied independently: 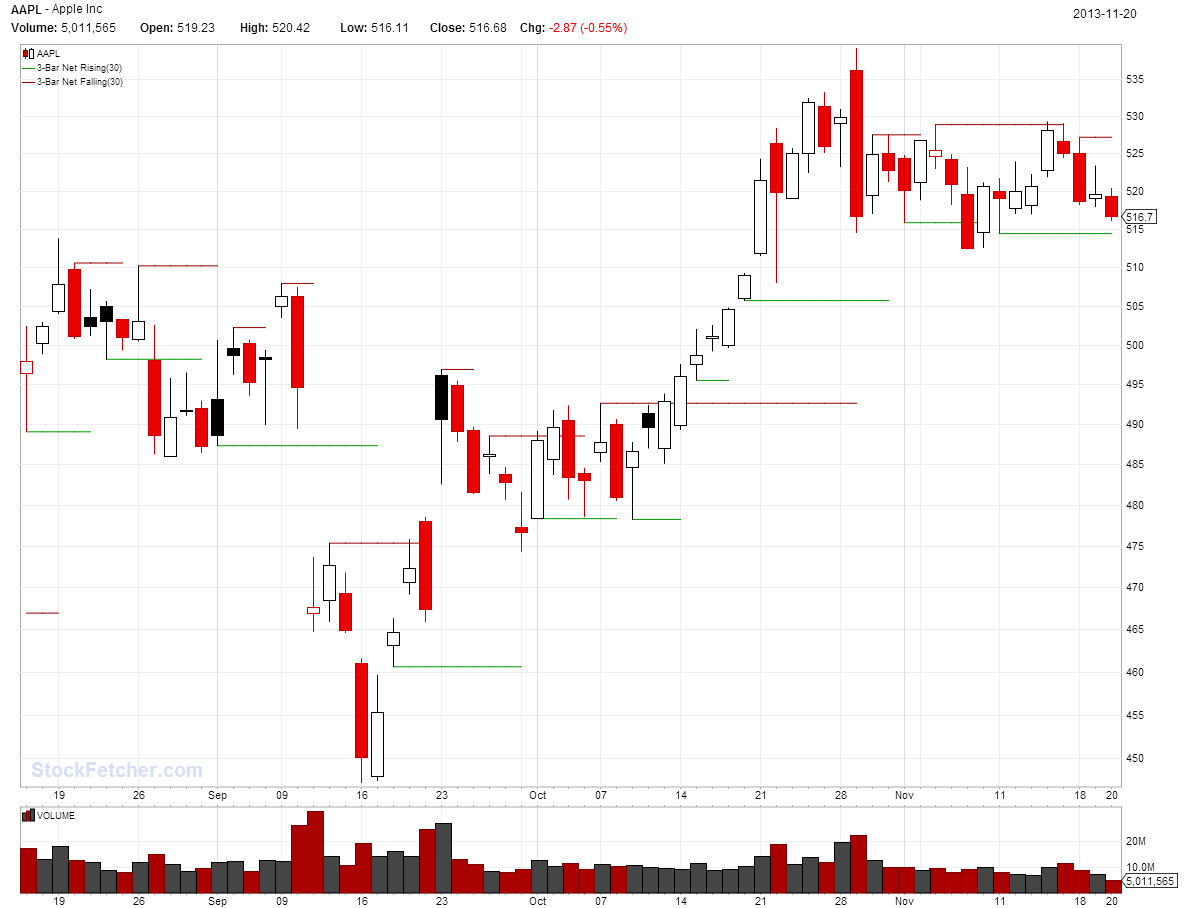 We suspect that applying a method, as you indicated, of detecting the most recent pivot as a starting point might produce a more accurate picture of the current trend. StockFetcher Support |
| alf44 2,025 posts msg #116898 - Ignore alf44 |
11/20/2013 3:41:46 PM ... hmmm ! I'm just not quite seein' it with either of these. . |
| SAFeTRADE 660 posts msg #116901 - Ignore SAFeTRADE |
11/20/2013 5:29:18 PM 4dayr is the day range over 4 days. Low to high. Try not to buy if the red line is over 100. |
| SAFeTRADE 660 posts msg #116902 - Ignore SAFeTRADE |
11/20/2013 5:46:55 PM Here are two pages from the man himself. 
Number 2  |
| SAFeTRADE 660 posts msg #116904 - Ignore SAFeTRADE modified |
11/20/2013 6:11:15 PM Another stab at it... Think of "4dayr" as a four day candle, it would have to be above 90% for it to reach a new high. |
| StockFetcher Forums · General Discussion · StockFetcher ... can this feature be added ? | << 1 2 3 4 >>Post Follow-up |