| StockFetcher Forums · Announcements · StockFetcher Chat | << 1 2 >>Post Follow-up |
| yermakdima 1 posts msg #124800 - Ignore yermakdima |
8/30/2015 10:05:25 AM Hello every one . I am new to StockFetcher . Great site , tons of technical info .. looks like amazing place to dig for DATA . However , i have problem of setting up my filters , namely I am desperately need to learn how to set up and see Support Resistance Levels on certain Stocks ... Can any one coach me on this topic . Thank you in advance . |
| four 5,087 posts msg #124801 - Ignore four |
8/30/2015 2:43:27 PM How do you define "Support Resistance Levels" ? PS Welcome to StockFetcher |
| Mactheriverrat 3,178 posts msg #124802 - Ignore Mactheriverrat modified |
8/30/2015 3:00:15 PM In the top right corner of most every page there is a Google search box type is support and resistance ----------------------------- draw resistance(25,12,2) draw resistance(45,15,2) draw resistance(65,10) ------------------------------ It will lead you to info on adding support and resistance line. One of the tools I use is after you run a filter search if you run your mouse over any stock chart a cross hair appears. I scroll up or down with just looking at different resistance and support areas. Here's some code that you can play around with that will give some lines where old resistance line might be draw high 4 week high |
| Mactheriverrat 3,178 posts msg #124803 - Ignore Mactheriverrat modified |
8/30/2015 3:36:42 PM Submit one can add code like draw high 4 week high to any filter. |
| Mactheriverrat 3,178 posts msg #124804 - Ignore Mactheriverrat |
8/30/2015 3:46:00 PM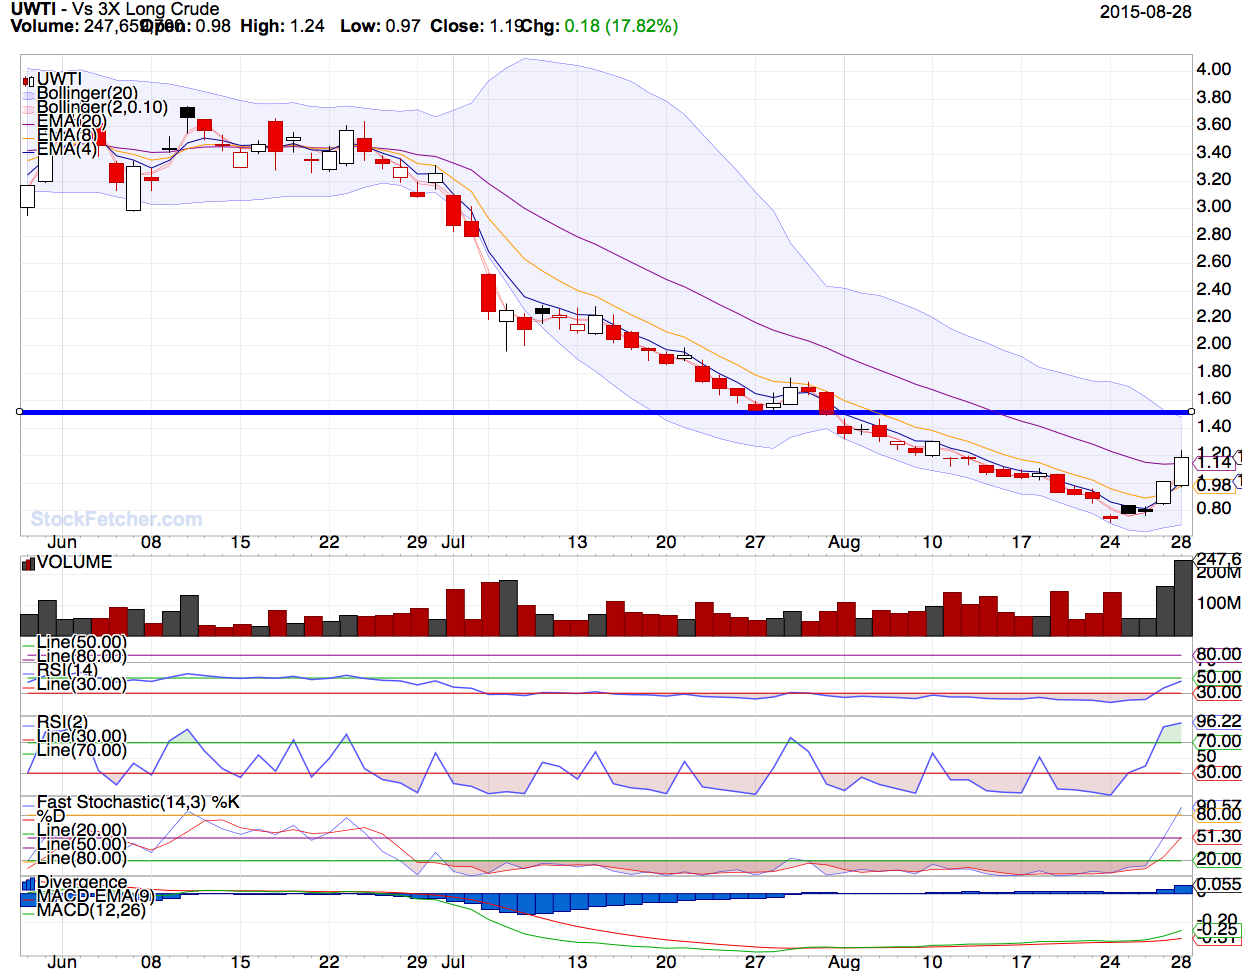 One can use the cross hairs to pin point older resistance line . In the case UWTI . On July 28 a old support of $1.52 is now the new resistance in its new uptrend which is near where the Upper Bollinger bands are. In this picture I just a line at the resistance line. |
| karennma 8,057 posts msg #124997 - Ignore karennma |
9/15/2015 2:22:22 PM Re: UWTI - I'm showing $10.47. Must've reverse split. That's what these sleazy ETF companies do when their garbage goes to zero. |
| AnSta 4 posts msg #126359 - Ignore AnSta |
12/2/2015 11:53:35 AM Dear After running a filter , in the results table we can point the mouse over a symbol and then a "standardized "chart window is coming. This window is always 3 months timeframe (daily basis). Is it possible to have a setting that this time window could be last 6 months ? |
| AnSta 4 posts msg #126360 - Ignore AnSta |
12/2/2015 11:59:21 AM Dear Sir Ignore my previous request for chart settings 6 months , I found the settings in the lower side of the internet page. Thank you. |
| StockFetcher Forums · Announcements · StockFetcher Chat | << 1 2 >>Post Follow-up |