StockFetcher Forums · Filter Exchange · Help markers<< >>Post Follow-up
thorodin
13 posts
msg #121043
Ignore thorodin
7/18/2014 8:53:44 AM

I want to display...

1. up days (volume increasing for the last 1 days and close is more than 4% above close 1 day ago)
2. down days (volume increasing for the last 1 days and close is more than 4% below close 1 day ago)

...in bars under the chart or arrows but I cant figure out how to do it.
Can somebody please help to do this.

Many Thanks,
Thor


four
5,087 posts
msg #121044
Ignore four
modified
7/18/2014 9:34:15 AM

does this work for UP days

Fetcher[
set{cl, count(close is more than 4% above close 1 day ago,1)}
set{vl, count(volume increasing for the last 1 days,1)}
set{up, cl + vl}
draw up > 1 /*BOTH set statements (CL and VL) must be true on the same day*/
add column cl
add column vl

low > 11
volume > 123123
]


thorodin
13 posts
msg #121045
Ignore thorodin
modified
7/18/2014 11:26:57 AM

Many thanks four! I've tried to tinker with it to get the staples for down days but couldn't make it work. Ideally there would be just one staple(green) for a day with more than 4% up on higher volume and one staple for more than 4% down(red) on higher volume like the lower indicator in this example taken from stockbee. Sorry I didn't post the picture earlier but I just figured out how to post a picture.


four
5,087 posts
msg #121046
Ignore four
modified
7/18/2014 12:21:49 PM
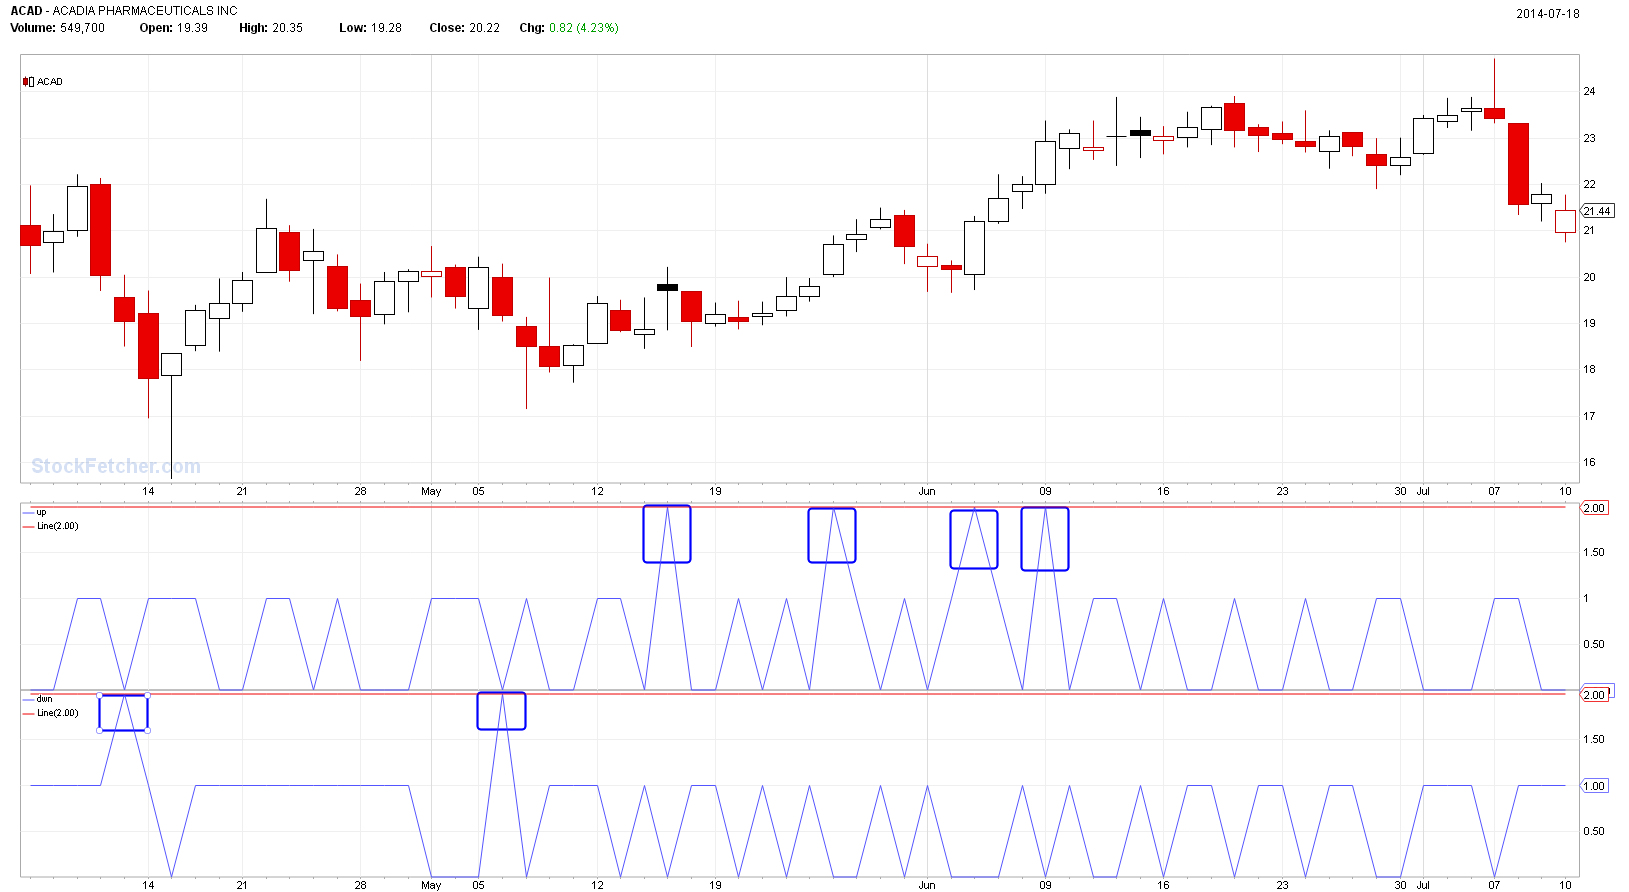
Fetcher[

set{cl, count(close is more than 4% above close 1 day ago,1)}
set{vl, count(volume increasing for the last 1 days,1)}
set{up, cl + vl}
/*BOTH set statements (CL and VL) must be true on the same day*/
draw up line at 2

set{cld, count(close is more than 4% below close 1 day ago,1)}
set{vld, count(volume decreasing for the last 1 days,1)}
set{dwn, cld + vld}
draw dwn line at 2

low > 11
volume > 123123

]


thorodin
13 posts
msg #121048
Ignore thorodin
7/18/2014 4:05:25 PM

Tanks again four! I made a little change in the volume for the down day which is also increasing and now it works perfect! Great job and thanks for helping! I will use the markers to see that there are no big down days(distribution) 4% before entering long in an uptrend.

Submit
Fetcher[

set{cl, count(close is more than 4% above close 1 day ago,1)}
set{vl, count(volume increasing for the last 1 days,1)}
set{up, cl + vl}
/*BOTH set statements (CL and VL) must be true on the same day*/
draw up line at 2

set{cld, count(close is more than 4% below close 1 day ago,1)}
set{vld, count(volume increasing for the last 1 days,1)}
set{dwn, cld + vld}
draw dwn line at 2

low > 11
volume > 123123

]


four
5,087 posts
msg #121049
Ignore four
modified
7/18/2014 6:21:32 PM

welcome and thanks

Wonder how are you defining the trend?

thorodin
13 posts
msg #121054
Ignore thorodin
7/19/2014 2:41:58 AM

Hi four, I'm using Kevin in GA's alpha filter for Alpha stocks and then I look for the strongest ones that has a bit of a sideways movement. I scan for the ones that are up 4% on high volume for the day and with your addition I can see that they didn't have any recent down days.

Submit
Submit
Fetcher[ close above 5
average volume(21) above 500000
add column sector

set{roc1, roc(21,1)}
set{roc3, roc(63,1)}
set{alpha1a, relative strength(SPY,21)*100}
set{alpha1, alpha1a - 100}
set{alpha3a, relative strength(SPY,63)*100}
set{alpha3, alpha3a - 100}
set{alpha, alpha1 + alpha3}
add column roc1
add column roc3
add column alpha1 {1 month alpha}
add column alpha3 {3 month alpha}
add column alpha {alpha score}
sort on column 10 descending

stocks of type not ETFs
volume increasing for the last 1 days
Show stocks where close is more than 4% above close 1 day ago

add column MACD Fast Line(3,13,5)
add column stochRSI(21,21)


set{cl, count(close is more than 4% above close 1 day ago,1)}
set{vl, count(volume increasing for the last 1 days,1)}
set{up, cl + vl}
/*BOTH set statements (CL and VL) must be true on the same day*/
draw up line at 2

set{cld, count(close is more than 4% below close 1 day ago,1)}
set{vld, count(volume increasing for the last 1 days,1)}
set{dwn, cld + vld}
draw dwn line at 2
]


StockFetcher Forums · Filter Exchange · Help markers<< >>Post Follow-up

*** Disclaimer *** StockFetcher.com does not endorse or suggest any of the securities which are returned in any of the searches or filters. They are provided purely for informational and research purposes. StockFetcher.com does not recommend particular securities. StockFetcher.com, Vestyl Software, L.L.C. and involved content providers shall not be liable for any errors or delays in the content, or for any actions taken based on the content.


Copyright 2022 - Vestyl Software L.L.C.Terms of Service | License | Questions or comments? Contact Us
EOD Data sources: DDFPlus & CSI Data Quotes delayed during active market hours. Delay times are at least 15 mins for NASDAQ, 20 mins for NYSE and Amex. Delayed intraday data provided by DDFPlus


This site is protected by reCAPTCHA and the Google Privacy Policy and Terms of Service apply.