| StockFetcher Forums · Filter Exchange · Interesting filter - perhaps the best I've seen so far | << 1 ... 4 5 6 7 8 >>Post Follow-up |
| hawkeyes002 49 posts msg #78819 - Ignore hawkeyes002 |
9/8/2009 7:52:48 PM so kevin how long do you keep these stocks after you buy them? |
| trendscanner 265 posts msg #78825 - Ignore trendscanner |
9/8/2009 9:19:14 PM Kevin, thanks for the clarification on the backtest. I think I'm probably backtesting a slightly different group of stocks than you were since I've only been backtesting the latest IBD 100 that you posted. I would expect that during the period Oct 31, 2008 through March 2009, there were different companies on the IBD 100 list from the current list so I'm not sure how relevant my backtesting with the current list is anyways. I ran probably 40 to 50 different variations of the basic BB/IBD 100 scan this last weekend, looking for ways to goose it's performance even better. I also looked at the charts from the individual trades to see what the actual entry and exits looked like,especially for the ones that weren't winners to try to figure out why some of the trades weren't working. I found that between April 09 and end of August 2009, if I eliminated stocks that had made more than 7 to 8 new highs during the preceeding period and used RSI(2) below 8 as a confirming condition for entering the trade (i.e.,in addition to close below the lower BB), it reduced the number of trades but increased the win:loss rate and the risk:reward ratio considerably. If you want to see the lines I used to constrain the filter to those conditions, just holler back and I'll post them It's a great filter, thanks for posting it. I may make some trades using it. if I do, I'll let you know what they are and how well they go. thanks Dean |
| Kevin_in_GA 4,599 posts msg #78835 - Ignore Kevin_in_GA |
9/8/2009 11:26:42 PM Hawkeyes: I keep the stock until it closes above the upper BB - in my backtesting since mid-2005, on 1020 trades the average hold time was 56 days. Portfolio did well today: Symbol ����Entry Price���� Current Price���� Yield (%)���� Days Held ACOR���� $21.92���� $21.61���� -1.41% 13 ATSI���� $2.74���� $2.59���� -5.47% 13 ESLR���� $1.73���� $1.86���� 7.51% 13 OTEX���� $35.40���� $35.58���� 0.51% 13 STAR���� $21.04���� $24.50���� 16.44% 13 DL���� $8.00���� $7.85���� -1.88% 11 NUS���� $17.50���� $17.30���� -1.14% 11 ARTG���� $3.92���� $4.01���� 2.30% 4 CA���� $20.82���� $21.76���� 4.51% 4 CCK���� $24.71���� $24.81���� 0.40% 4 DLB���� $37.26���� $37.73���� 1.26% 4 FHCO���� $5.68���� $6.08���� 7.04% 4 JCOM���� $21.00���� $21.84���� 4.00% 4 NFLX���� $40.93���� $41.48���� 1.34% 4 AMED���� $35.86���� $35.83���� -0.08% 1 AVERAGE YIELD:���� 2.36% ���� |
| hawkeyes002 49 posts msg #78836 - Ignore hawkeyes002 |
9/9/2009 12:06:14 AM hey trendscanner could you post your filter please? thanks |
| TraderMojo 16 posts msg #90757 - Ignore TraderMojo |
4/3/2010 9:42:50 PM Any updates from Kevin or anyone else using this filter? I backtested in over the last 4 months and came up with similar results as previously reported. However, the biggest question in my mind is the large percentage of trades (e.g. 40 to 50%) that are still open at the end of the test. Is the filter performing so well simply because we're not ever ending the many trades that go against us? |
| Eman93 4,750 posts msg #91021 - Ignore Eman93 |
4/10/2010 1:06:04 PM If you trade this for real I would not stick to the exit criteria.... If it made a nice gain but did not close above the bole band I would still take profits... if it moved against me I would dump it.... most of the eyeballs I did showed the day it hit was a big gap down and made a market swing low.. I would hold that as my stop. I don't think you need the IBD stocks this dose not have many hits any way |
| Kevin_in_GA 4,599 posts msg #91040 - Ignore Kevin_in_GA |
4/11/2010 6:29:56 AM Not trading this any more - basically I realized that too much capital was being tied up in trades that were not going anywhere. If you look at the equity summary (instead of the ROI, which is misleading), you only make about 1-2% a month, before commissions. Comparing that to a simple buy and hold on SPY you are not beating the market. I would make two revisions to this approach if I were to return to it: 1. Only go long if the stock is above its MA(100) - make sure it is a pullback during an uptrend. 2. Wait for a confirmation signal - the stock must close back inside the BB, preferably with a white candle on the day following the drop below the LBB. Several of my trades (e.g., STEC) just kept dropping after I entered, because I did not wait for any confirmation that the selling had ended. Also, the (16,2.5) BB settings should be looked at again, as these were optimized for a select set of IBD stocks and may no longer be the ideal values. I have been looking at (10,2) on a lot of charts and this seems to be pretty good at catching most of the bounces off the lower BB. I also agree with Eman - you need to set a stop loss on this strategy to get out of losing trades. I optimized this without stop losses, and in retrospect think that this is more of a weakness than a strength. |
| four 5,087 posts msg #131493 - Ignore four |
9/25/2016 5:30:55 PM pop |
| four 5,087 posts msg #131495 - Ignore four |
9/25/2016 6:17:26 PM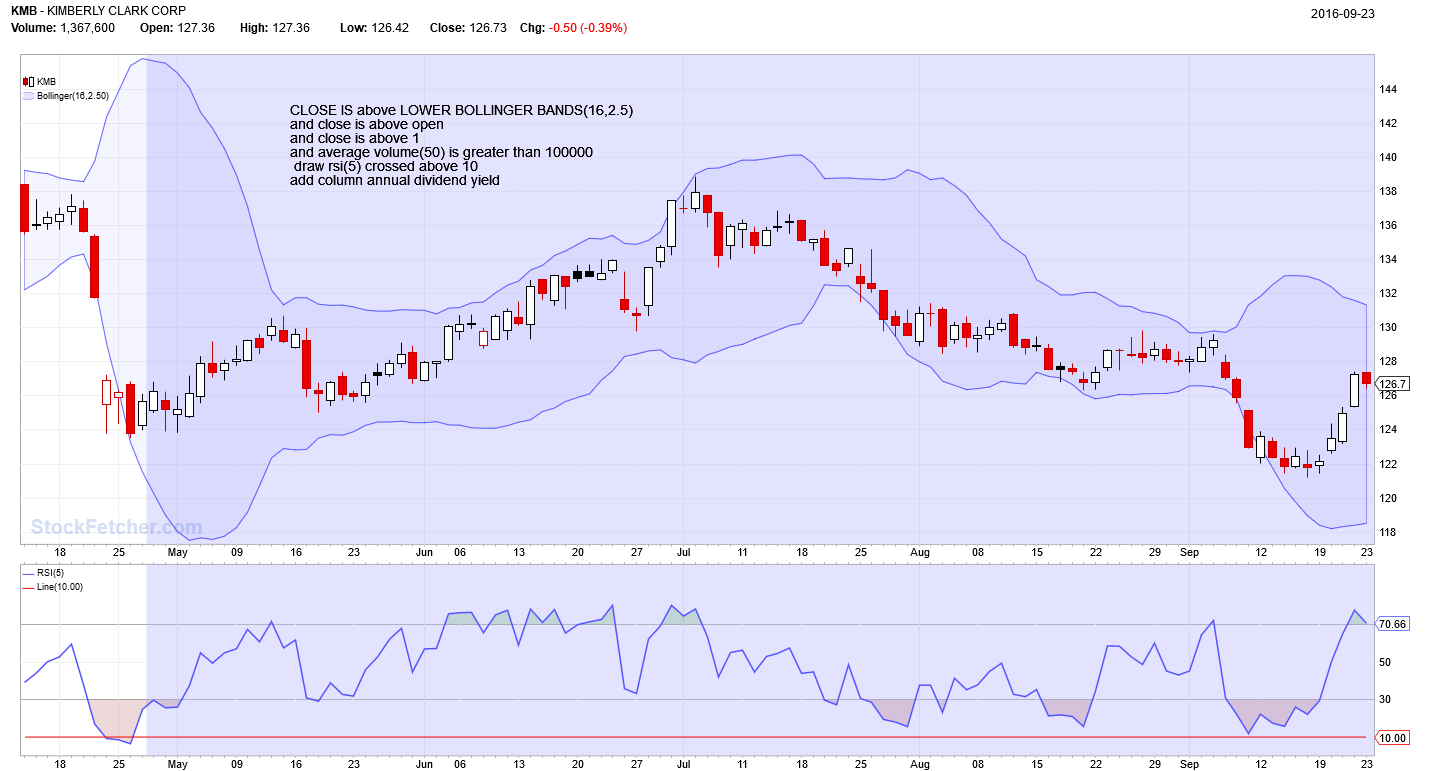 |
| shillllihs 6,102 posts msg #131509 - Ignore shillllihs |
9/26/2016 4:00:01 PM You spoke of another strategy that might follow Vix better, have you worked out your exit strategy and will you be sharing with SF. |
| StockFetcher Forums · Filter Exchange · Interesting filter - perhaps the best I've seen so far | << 1 ... 4 5 6 7 8 >>Post Follow-up |