StockFetcher Forums · Filter Exchange · Just another GUPPY filter<< >>Post Follow-up
graftonian
1,089 posts
msg #152945
Ignore graftonian
7/4/2020 2:51:07 PM

Happy Independence Day
Any thoughts on NSC, FCN, INGR, SDIV?
Fetcher[
/* the guppy averages ver2 7/4/2020 */
OPTIONABLE
Average Volume(30)>5000000
CHART-TIME IS 1 year
/***TRADERS*****/
draw ema(03)
draw ema(05)
draw ema(08)
draw ema(10)
draw ema(12)
draw ema(15)
/*****INVESTORS****/
draw ema(30)
draw ema(35)
draw ema(40)
draw ema(45)
draw ema(50)
draw ema(60)
/********/
draw IFT(5,9)
/* July 4, 2020 */
/*how "tight" are the averages */
set{var1b, EMA(60) - EMA(3)}
set{var1a, var1b / EMA(3)}
set{var1, ABS(var1a)}
add column var1 and draw var1
sort on column 5 ascending
var1 < 0.001
]


Mactheriverrat
3,131 posts
msg #152946
Ignore Mactheriverrat
7/4/2020 3:32:06 PM

Welcome back Graftonian!!!!!!!!


Mactheriverrat
3,131 posts
msg #152947
Ignore Mactheriverrat
7/4/2020 4:21:21 PM

IMHO.

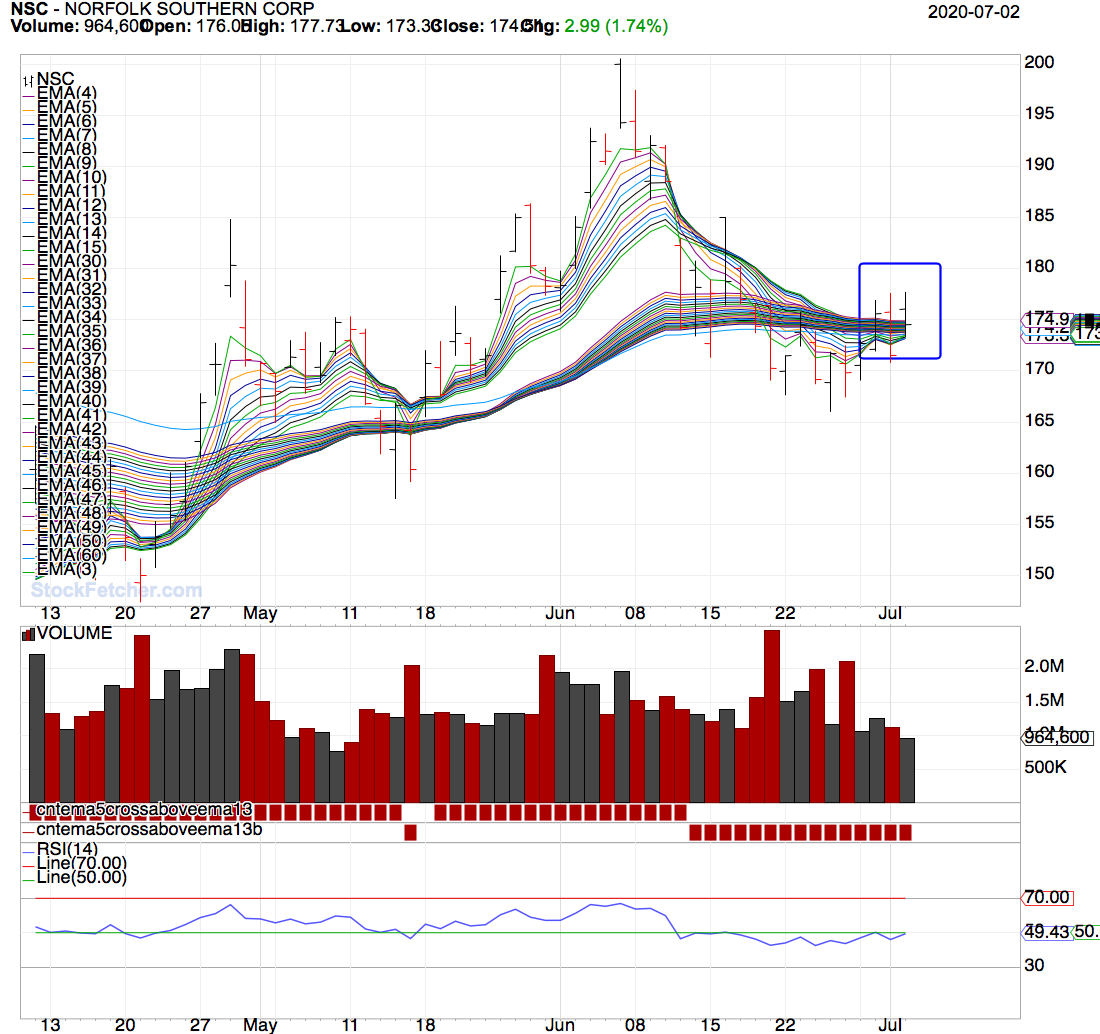
NSC - Long term Bullish, short term still bearish. If EMA 5 can cross above EMA 13 then I would say Buy.


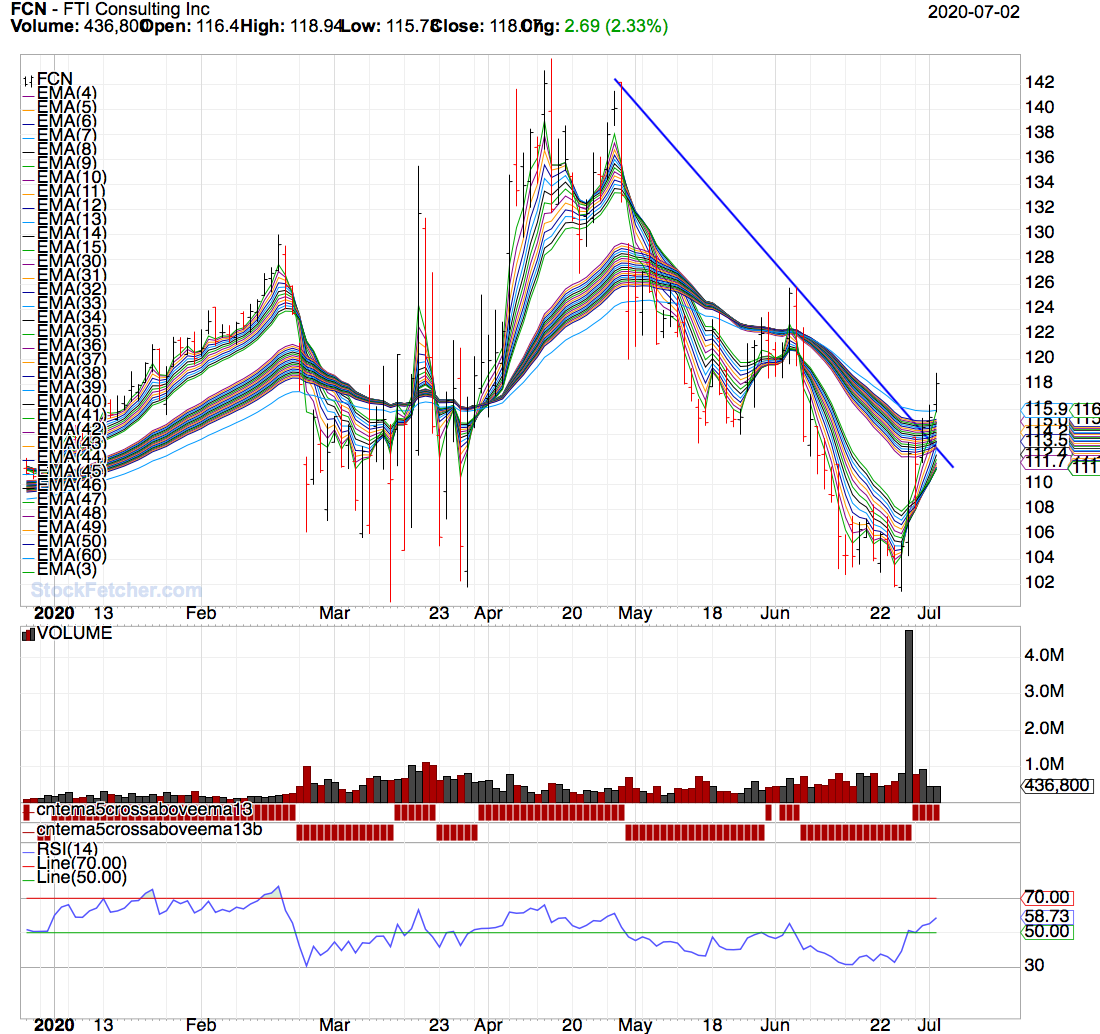
FCN - Long term Bearish , short term ema's starting to intercede with long term - State of possible trend change. Starting to squeeze long term MMA's.


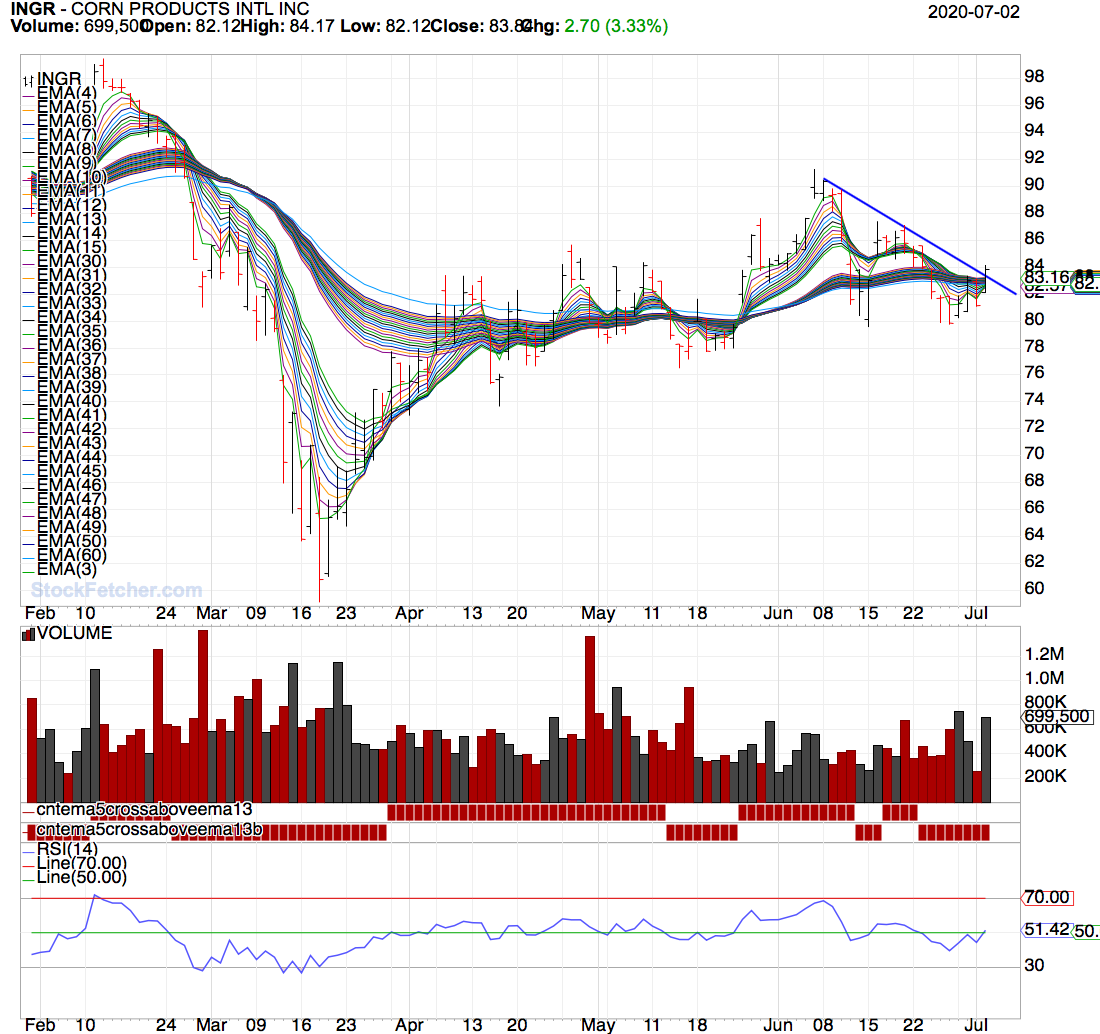
INGR - Long term Bullish , short term pullback without making long term MMA's squeeze or rollover. Like NSC if EMA 5 makes a cross above EMA 13 then its back in. Price broke the down trend line ( a positive).


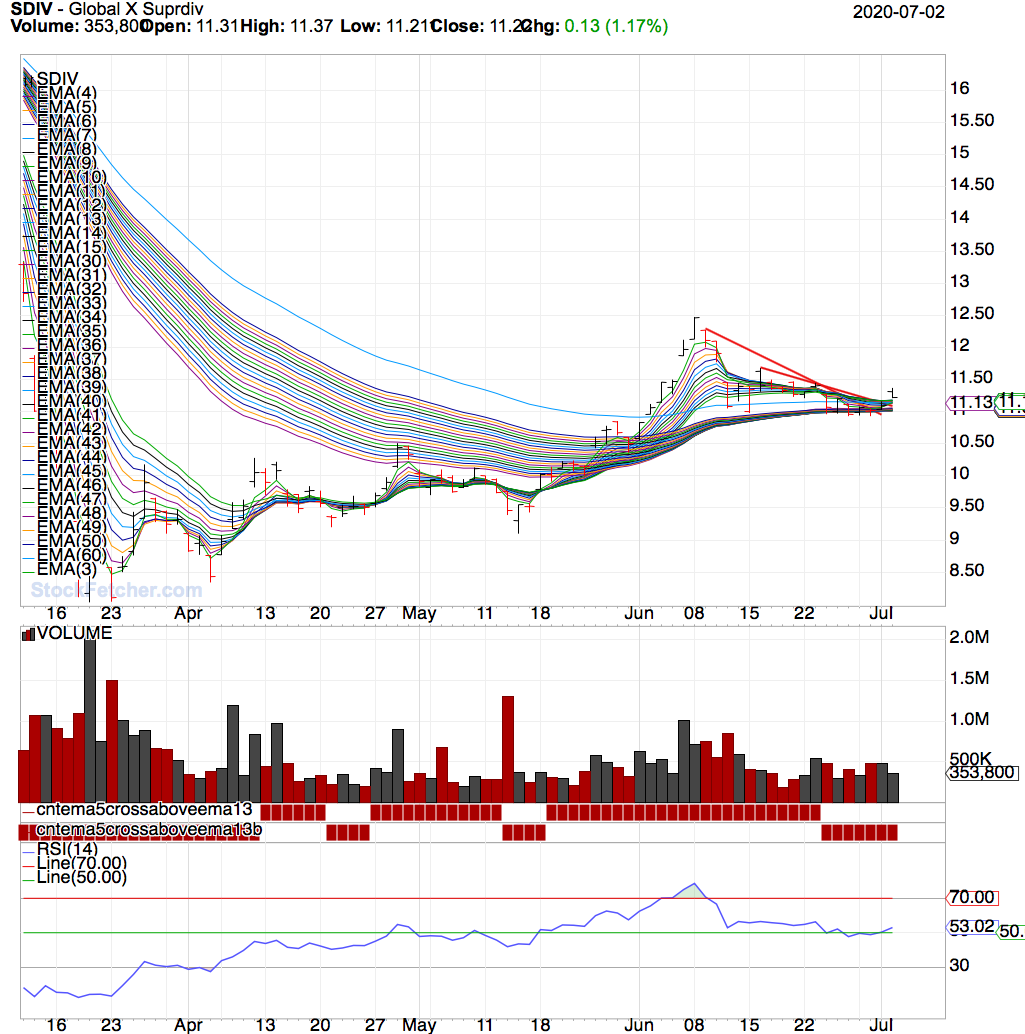
SDIV - Long term very compressed . Seems pull back since around early June never let the long terms rollover. If the short terms can become with say a EMA 5 / 13 cross it will pull the long terms to rollover. Remember that Mr. Guppy said from compression comes expansion. Broke all downtrend lines.


Fetcher[
Submit
Fetcher[
apply to symlist to symlist to watchlist to symlist(spy,nsc,fcn,ingr,sdiv)


add column RSI(14) line at 50.00


/* e513 is number of consecutive days ema(5) above (+)/below(-) previous eMA(13) */
set{e513b,days( ema(5) is above eMA(13) ,250)}
set{e513a,days( ema(5) is below eMA(13) ,250)}
set{e513, e513a - e513b} and add column e513 {e513}

Set{cntema5crossaboveema13,count( ema(5) > ema(13) ,1)}
draw cntema5crossaboveema13

Set{cntema5crossaboveema13b,count( ema(5) < ema(13) ,1)}

draw cntema5crossaboveema13b


chart-time is 50 days

add column Average Day Range(30)

do not draw Average Day Range(30)

Draw RSI(14) line at 70.00
Draw RSI(14) line at 50.00

draw ema(3)
draw ema(4)
draw ema(5)
draw ema(6)
draw ema(7)
draw ema(8)
draw ema(9)
draw ema(10)
draw ema(11)
draw ema(12)
draw ema(13)
draw ema(14)
draw ema(15)


draw ema(30)
draw ema(31)
draw ema(32)
draw ema(33)
draw ema(34)
draw ema(35)
draw ema(36)
draw ema(37)
draw ema(38)
draw ema(39)
draw ema(40)
draw ema(41)
draw ema(42)
draw ema(43)
draw ema(44)
draw ema(45)
draw ema(46)
draw ema(47)
draw ema(48)
draw ema(49)
draw ema(50)

Draw ema(60)

add column separator


]


StockFetcher Forums · Filter Exchange · Just another GUPPY filter<< >>Post Follow-up

*** Disclaimer *** StockFetcher.com does not endorse or suggest any of the securities which are returned in any of the searches or filters. They are provided purely for informational and research purposes. StockFetcher.com does not recommend particular securities. StockFetcher.com, Vestyl Software, L.L.C. and involved content providers shall not be liable for any errors or delays in the content, or for any actions taken based on the content.


Copyright 2022 - Vestyl Software L.L.C.Terms of Service | License | Questions or comments? Contact Us
EOD Data sources: DDFPlus & CSI Data Quotes delayed during active market hours. Delay times are at least 15 mins for NASDAQ, 20 mins for NYSE and Amex. Delayed intraday data provided by DDFPlus


This site is protected by reCAPTCHA and the Google Privacy Policy and Terms of Service apply.