| StockFetcher Forums · Filter Exchange · KEVIN'S "MONDAY MORNING FILL THE GAP" FILTER | << 1 2 3 4 5 ... 6 >>Post Follow-up |
| 03bsbme 20 posts msg #104344 - Ignore 03bsbme |
1/10/2012 9:09:17 PM Nice work again Kevin. I was wondering how StrataSearch calculates the exit. If this were done in Stockfetcher and the stop limit was hit it would trigger the trade. It would then use the high for that day to see if the "gap" was filled. Does StrataSearch use the same method? That can skew the results quite a bit. For example if the stock actually gaps up and then keeps going down below the 3% and never rises after that, Stockfetcher would actually calculate that as filling the 3% gap on the first day. |
| Kevin_in_GA 4,599 posts msg #104345 - Ignore Kevin_in_GA modified |
1/10/2012 9:29:59 PM Possibly. It also uses EOD, so the order of fill versus exit is not clear. No real way around it except to hand check each trade. Or paper trade this moving forward and chack against the same trades in either system. EDIT: Been thinking about this, and this could be a real issue. Example: the stock opens just above the previous close but drops below the 3% limit order toward the end of the day. The trade would be registered as a complete trade, since the order of events was not specified. I have seen a large number of completed trades in this fashion when looking at the individual backtest trades. They show up as length of trade = 0 days. There are a lot of these, perhaps more than really occur. Need to think about this ... perhaps a requirement that the trade cannot be closed on the day it is opened would be helpful? |
| Kevin_in_GA 4,599 posts msg #104348 - Ignore Kevin_in_GA |
1/11/2012 8:44:11 AM I have the code to adjust this system to insure that no exit can occur on the day of purchase, so that should eliminate any false trades. Will run the backtest tonight. No predictions on the results, but my fingers are crossed ... Kevin |
| mmaurice 51 posts msg #104375 - Ignore mmaurice |
1/13/2012 9:59:38 AM How did the new code work out? |
| Kevin_in_GA 4,599 posts msg #104420 - Ignore Kevin_in_GA modified |
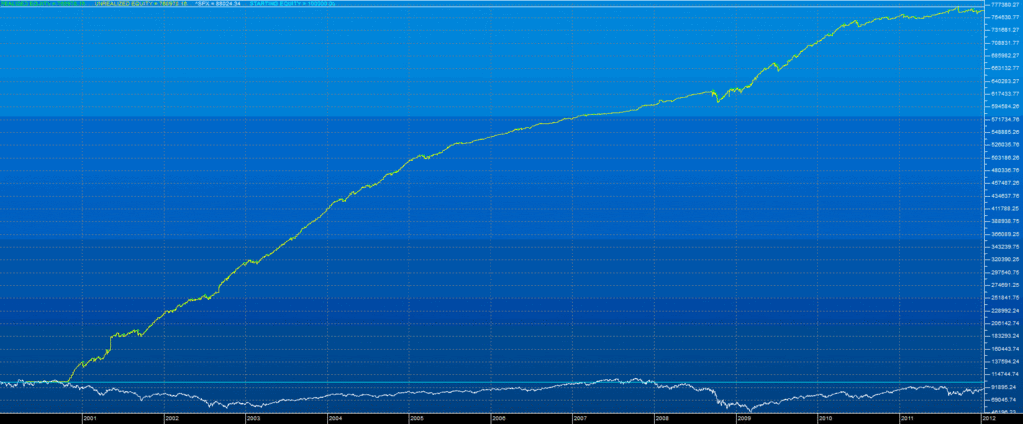
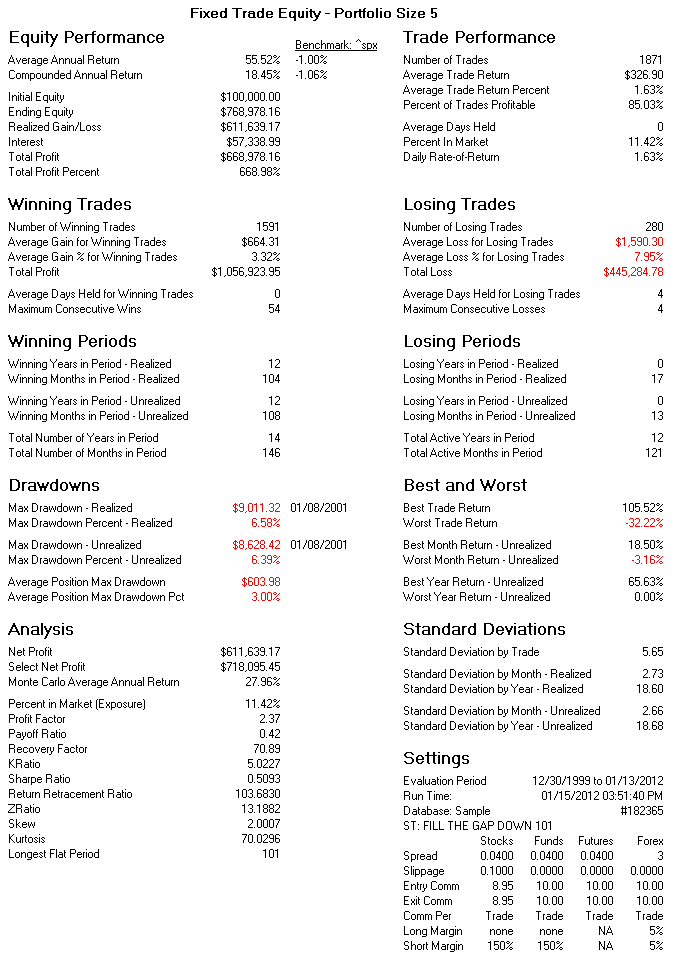
1/15/2012 10:21:59 PM It took me a few days to refine what I really wanted this to be. Originally it was an opening gap down on Monday, then it morphed into a limit order for a 3% drop, then I realized there was a coding error, ... I put the few days into refining the code, and I wanted it to be easily implemented here using SF. That meant going back to the original premise of a weekly open gap down, since that was readily coded. I looked at a wide range of time ranges, gap sizes, frequencies, and percent fills for the Russell 2000 stocks from mid-2000 through to last Friday. The best combination over the past 11 years is captured here - just run this filter over the weekend, and track all of the stocks with PCT_GAPFILL at 0.7 or higher. This weekend there were 145 or so stocks you need to watch. My thinking is to set up a watchlist with these stocks and just run a filter on Monday morning that says "open is below close 1 day ago*0.98". Buy any that show up on the list, especially if they have moved lower. OK, so that's the filter, but how well did it backtest? The following chart and stats are based on a few things: 1. All trades include $0.04 bid/ask spread on both ends 2. Slippage is 0.1% 3. Commissions are 8.95 per side 4. Trade amounts are ALWAYS FIXED at $20,000 and a portfolio size of 5. This is not a variable trade strategy, which means even if you have $1,000,000 you still would only risk $100,000 max in any week. 5. All open trades are closed on Friday. No positions held over the weekend. 

A key thing about this approach - no indicators are used. The trades are selected based solely on statistical performance over the past 80 weeks. Note also that the win percentage is quite high at 85%, and the Sharpe ratio is insanely good (this number is per month, so you need to multiply it by the square root of 12 (3.46), which gives you a ratio of 1.76 through an 11 year period with two major recessions). No stop loss used - I might look at including one, but almost every backtest I have run with one ends up performing worse. Enjoy. Kevin |
| jackmack 334 posts msg #104422 - Ignore jackmack |
1/16/2012 8:35:39 AM Kevin - very interesting indeed. One quick question - since this filter and your Z-score filter are both looking for a GAP DOWN before entering a trade would it not be possible to combine some of the Z-score parameters into this Monday gap filter and come up with one smoking hot filter? Thank you - your work is amazing by the way jackmack |
| gloyd46 1 posts msg #104425 - Ignore gloyd46 |
1/16/2012 12:19:15 PM Kevin -- love your filters. I learned a lot from the 5% a week filter and this one looks to be no different. Many thanks offered your way. One quick question.... when market holidays fall on a Monday (like today), do any adjustments need to be made to the filter? |
| Kevin_in_GA 4,599 posts msg #104427 - Ignore Kevin_in_GA |
1/16/2012 1:34:07 PM No, because it is based on the weekly open, which would be the first day of the trading week. I coded this into Stratasearch as well to correct for this, so the stats and equity curve factor this in. Kevin |
| mahkoh 1,065 posts msg #104428 - Ignore mahkoh modified |
1/16/2012 1:45:24 PM Kevin, am I right to assume that "average days held for winning trades" in the Winning Trades column being 0 means that the bulk of these trades were closed out on the same day they were opened? And looking back in time there are a couple of times where there were many hits to the filter. On Nov 21 there were over 80 candidates, on Oct 31 over 70. If there are more than 5 hits do you pick the ones with the highest % of gaps filled or the ones with the largest gap? (As the latter are the ones with the biggest profit potential) |
| mahkoh 1,065 posts msg #104434 - Ignore mahkoh modified |
1/16/2012 5:17:18 PM Regarding my last question I ran this filter Offset the filter back to Fridays. Profit if gapfilled is the gap, if column gapfill = 0 than the gap was not filled and column profit 2 is the result for that week.(actually the week before but I needed to do that to get the weekly high accurate.) Do not forget to disregard the ones with % gapfilled below 70. A syntax to filter those out runs into subscription limitations. Comparing these results with those when the filter is run with "column % of gaps filled" descending gives me the impression that it is a safer bet to go with the ones that have the highest gapfills. |
| StockFetcher Forums · Filter Exchange · KEVIN'S "MONDAY MORNING FILL THE GAP" FILTER | << 1 2 3 4 5 ... 6 >>Post Follow-up |