| StockFetcher Forums · Filter Exchange · McClellan Oscillator and SPY | << 1 2 3 4 >>Post Follow-up |
| snappyfrog 753 posts msg #160226 - Ignore snappyfrog |
3/31/2023 9:54:29 PM Nice |
| snappyfrog 753 posts msg #160501 - Ignore snappyfrog |
8/18/2023 8:14:53 AM Still trading the McClellan Oscillator. This last run down, it gave plenty of warning and the other indicators gave me confidence in this new down trend. Still holding puts, great run so far. Entry was at open on the day of the blue square. 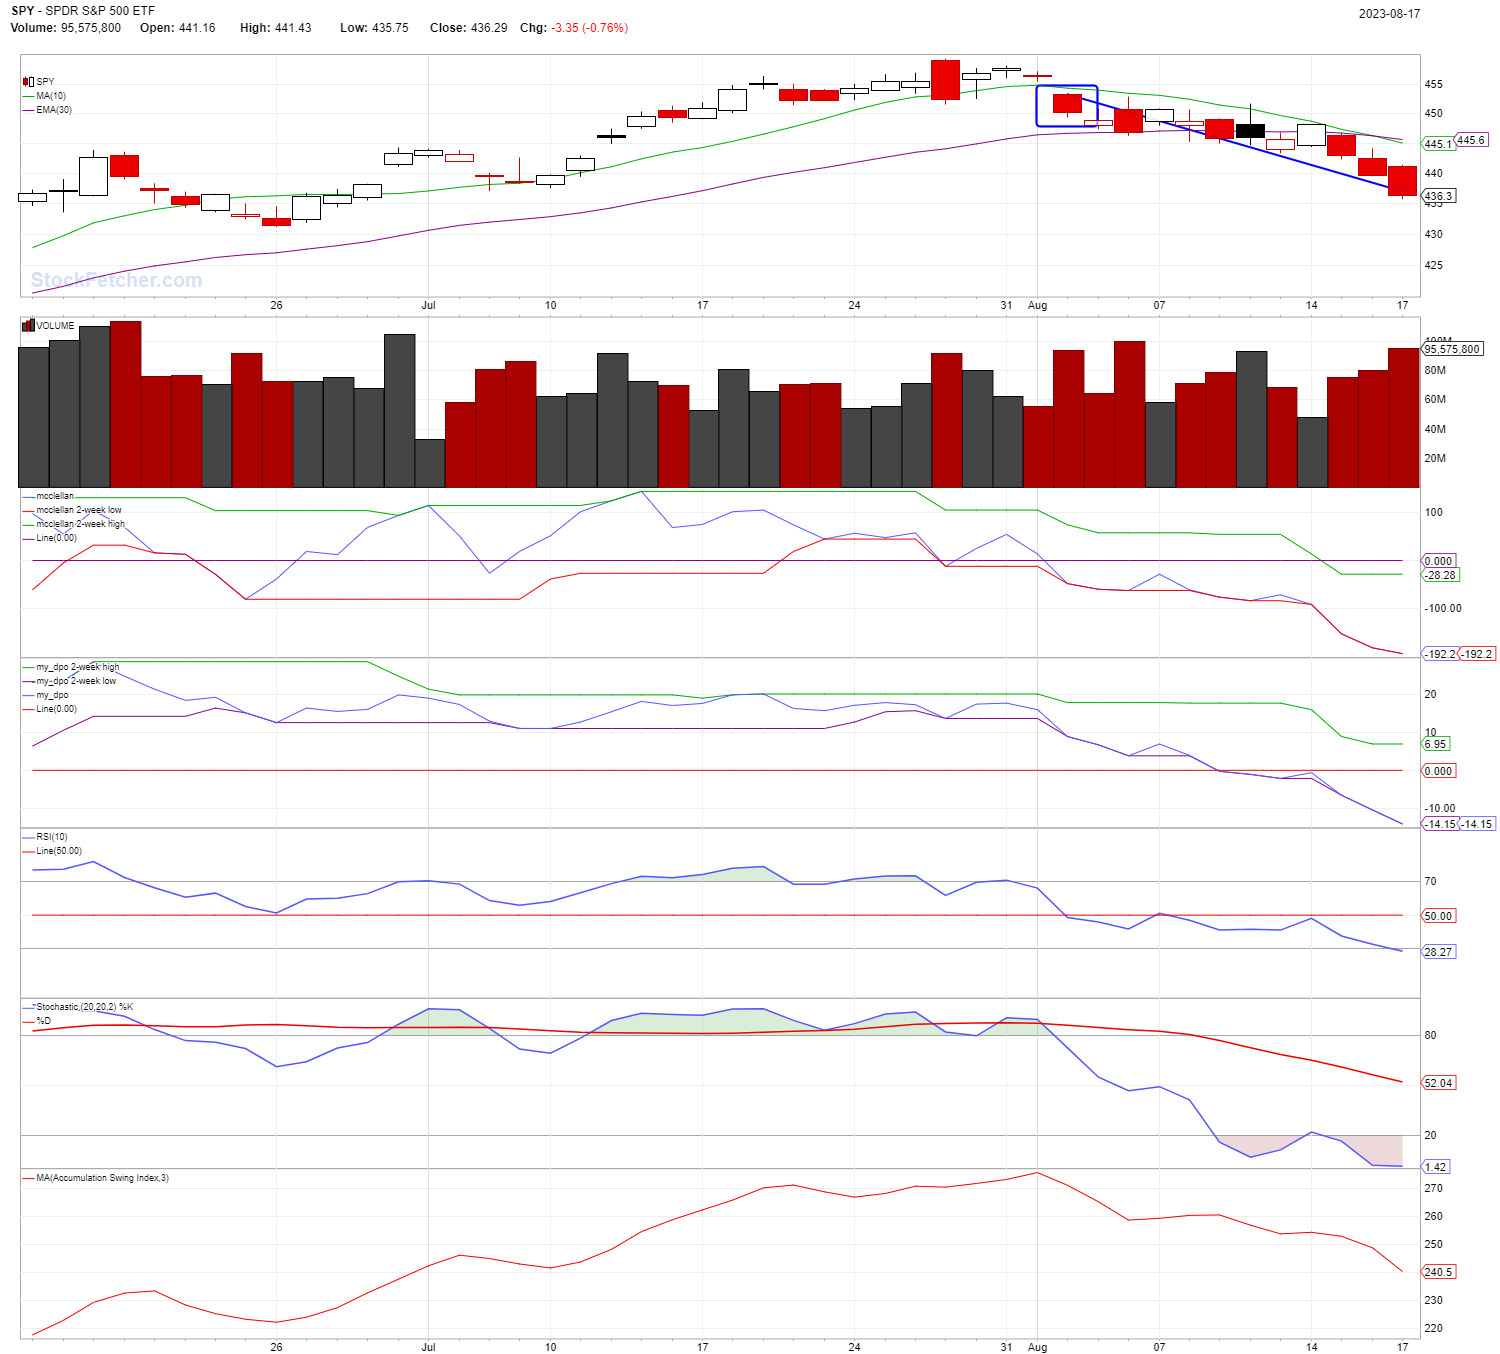 |
| snappyfrog 753 posts msg #160583 - Ignore snappyfrog |
9/27/2023 12:11:30 PM This last run has been really good. Still holding PUT options on SPY. Bought 09/18 $443 puts at $567 each. Now valued at $1879 each. Yellow arrow shows when I bought.  |
| snappyfrog 753 posts msg #160642 - Ignore snappyfrog |
11/9/2023 4:34:37 PM Going bearish on SPY due to McClellan falling for last 4 days. The reason I did not go bearish sooner was due to Accumulation / Distribution and RSI(10) still climbing. This afternoon RSI(10) rolled over and A/D flattened out. The divergence between McClellan and price is enough to make me go bearish this afternoon. 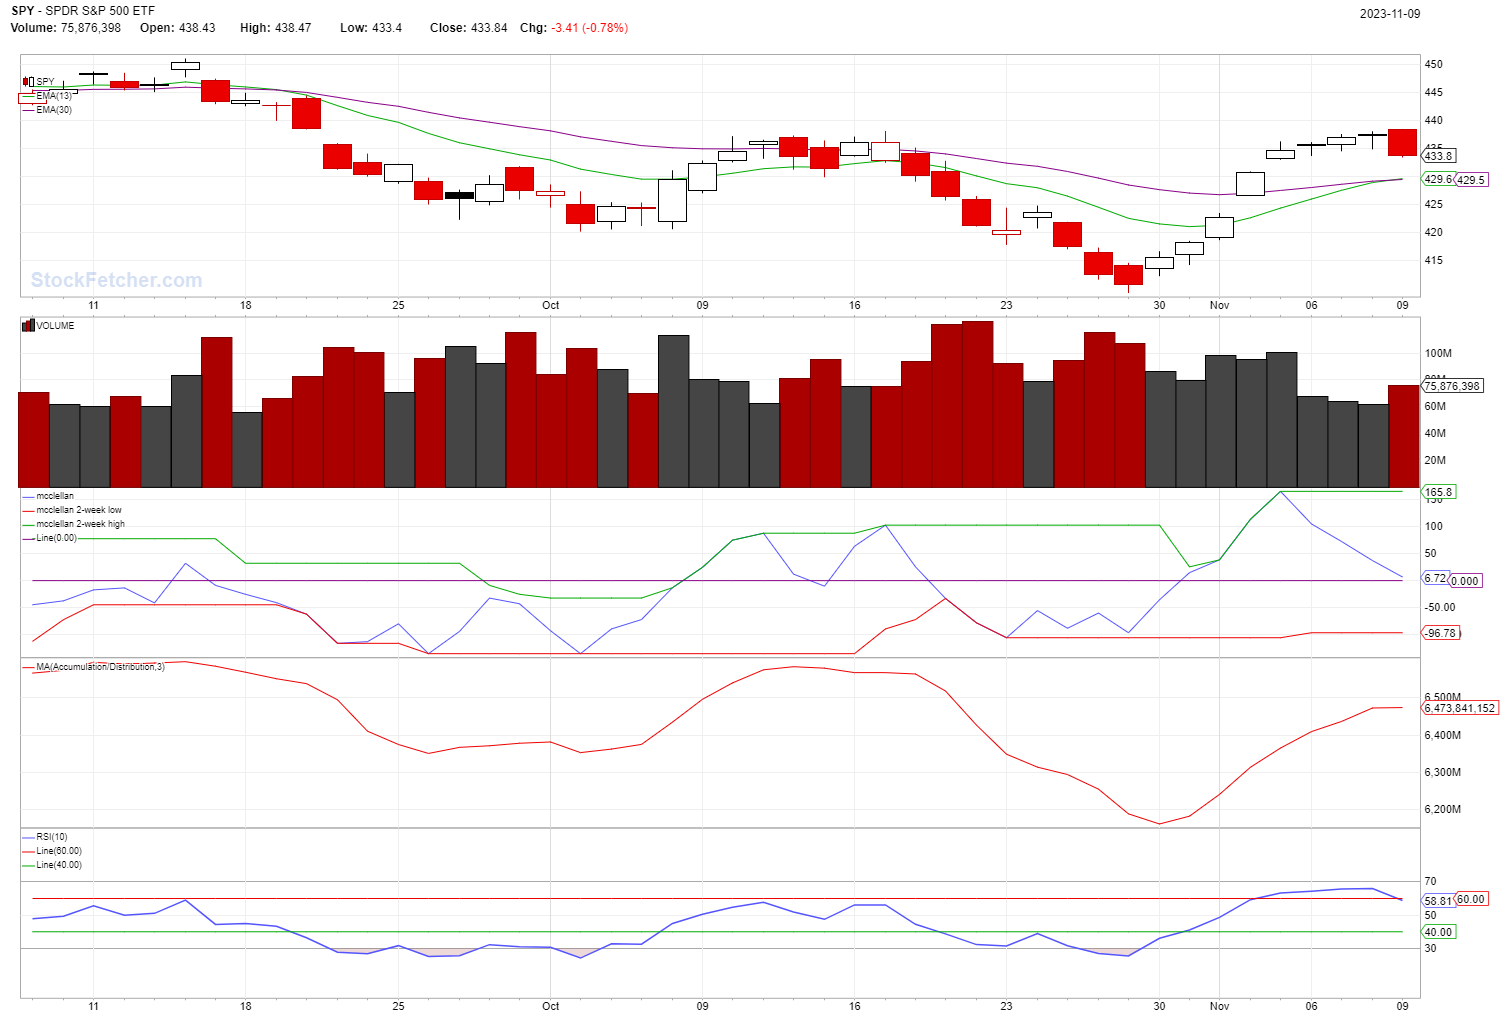 |
| snappyfrog 753 posts msg #160643 - Ignore snappyfrog modified |
11/9/2023 4:41:19 PM My latest rendition of this filter that I am using now. |
| snappyfrog 753 posts msg #160644 - Ignore snappyfrog modified |
11/9/2023 4:44:10 PM Not sure why that didn't work. Fixed now. |
| snappyfrog 753 posts msg #160649 - Ignore snappyfrog |
11/12/2023 9:17:45 AM I broke my own rules and got in the reversal too soon. Stop losses took me out and now I am waiting on Monday to decide to go bullish again or wait. |
| Mactheriverrat 3,178 posts msg #160650 - Ignore Mactheriverrat modified |
11/12/2023 12:27:52 PM chart-length is 35 days draw RSI(2) line at 70 draw RSI(2) line at 30 draw RSI(2) line at 10 draw RSI(2) line at 5 draw cma(rsi(2),2) |
| snappyfrog 753 posts msg #160651 - Ignore snappyfrog |
11/12/2023 8:23:39 PM Mac, Are you adding that to my filter or on its own? Are you looking at the crossover of the lines or moving above 10? 30? |
| Mactheriverrat 3,178 posts msg #160652 - Ignore Mactheriverrat modified |
11/12/2023 9:57:10 PM Just adding to your filter- RSI 2 still looks bullish on all your ticker's . Just playing around with it |
| StockFetcher Forums · Filter Exchange · McClellan Oscillator and SPY | << 1 2 3 4 >>Post Follow-up |