| StockFetcher Forums · Filter Exchange · RSI 2 Bounce Filter | << 1 2 3 >>Post Follow-up |
| bert123 56 posts msg #160032 - Ignore bert123 |
1/22/2023 7:22:30 PM Regarding my last post, I forgot to add the following to the ACLX example columns: After 1 day 17% After 2 days 33% After 3 days 100% So, after 1 day after rsi(2) crossed below 10, price closed above MA(5) 17% of the time (1 of 6) This counts the day of the rsi(2) cross below 10. |
| nibor100 1,103 posts msg #160037 - Ignore nibor100 |
1/26/2023 12:09:22 PM @bert123, Below is visual filter closer to what I think you are wanting in columns. I've limited it to ACLX only, basically you look for a box on the RSI(2) <10 line and then the nearest box on the line below it to the right is the first cross of the 5 period moving average. Then you move your cursor up vertically to either the 1 day gain or 2 day gain graphs and figure out the gain you would have received. I only show 2 gain graphs to reduce clutter, but 3 day and 4 day gains, etc. can easily be added. I'm not sure there is way to get this to columns in SF because of the multiple hits in the past being virtually unreachable using SF code, but I still have a couple more approaches I can try. Do you have regular or advanced subscription for SF? Thanks, Ed S. |
| bert123 56 posts msg #160039 - Ignore bert123 |
1/26/2023 4:05:19 PM Hi Nibor, Thanks for the follow up but I won't be able to look at this and respond until Monday at the earliest - headed out of town. Another two examples that I am trading are AAL, out today, and MDRX, still holding until it gets above the MA(5) or I stop out. If you pull up a 6 month chart on both, you'll see that they have performed relatively well in the past 6 months. These are the type I look for. Looking at the horizontal RSI(2) occurrences in the filter really helps and is a big improvement over what I've been doing. A column display to augment that would be ideal. Thanks again! |
| bert123 56 posts msg #160051 - Ignore bert123 |
1/30/2023 5:48:18 PM Hi Ed S., Your filter modifications are very helpful and yes, I have the advanced subscription. Regarding Hold Time, I sell at or near the close on the first day the price crosses above ma(5) or I am stopped out, whichever comes first. So, 2 day gain, 3 day gain, etc. is not needed for my purposes. What would be helpful, but maybe not possible, would be 2 columns that would display the following: 1. Average Profit 2. % Profitable Using the filter, I would add the line : RSI(2) crossed below 10 in last one day. The filter is run about 1/2 hour before close to allow time for analysis and submitting a Market On Close order (Nasdaq stocks only). Using ACLX as the only stock in your example, you'll find the most recent result on 1/11, which shows 6 occurences counting 1/11. Looking at the previous 5 results we see that entering on the close of the day the filter is run and exiting on the close when it crosses above ma(5) gives the following results: 8/19 +3.5% 8/26 +7.3% 9/22 +6.7% 10/7 +10% 11/16 + 5.5% The filter run on 1/11 would have the following columns in addition to the standard ones: RSI(2) crossed below 10 Occurrences (already in the filter) Average Profit (6.6% for ACLX) - new column % Profitable (100% for ACLX) - new column I would then sort by the % Profitable column descending and look for a candidate to trade. Thanks to what has already been accomplished I can still get to great candidates with the visual approach. However, the above additions would greatly speed up the process. And, if this can't be done, I am still miles head of where I started, and I greatly appreciate the contributions - thanks again. |
| Mactheriverrat 3,178 posts msg #160055 - Ignore Mactheriverrat modified |
1/31/2023 11:05:11 AM There is a wealth of information here on SF on RSI(2). I've been using TRO RSI 2 revisited . His filter posts rsi(2) < 25 the the next day I see which stocks have moved up from the previous day. It can get one in on any uptends . I ve changed some of the price and volume content as my taste are different. https://www.stockfetcher.com/forums/Filter-Exchange/RSI-2-REVISITED/37687/110 |
| Mactheriverrat 3,178 posts msg #160056 - Ignore Mactheriverrat |
1/31/2023 9:42:05 PM RSI(2) can get you in on current uptrend. Just like stock don't go up or down every day but trends can more for weeks up or down. //* rsi2 is number of consecutive days rsi(2) above (+)/below(-) previous 60 *// set{rsi2b,days( rsi(2) is above 60 ,250)} set{rsi2a,days( rsi(2) is below 60 ,250)} set{rsi2, rsi2a - rsi2b} and add column rsi2 {rsi2} do not Draw rsi2 Set{cntrsi2,count( rsi(2) > 60 ,1)} draw cntrsi2 Set{cntrsi2b,count( Rsi(2) < 60 ,1)} draw cntrsi2b |
| bert123 56 posts msg #160062 - Ignore bert123 |
2/2/2023 9:33:02 AM Thanks Mac - I appreciate your input! |
| Mactheriverrat 3,178 posts msg #160063 - Ignore Mactheriverrat modified |
2/2/2023 10:59:23 AM @bert123 One can take that code and get in on uptrends or downtrends at any time . Now in downtrends I would move the trigger from 60 to 30 . Now by looking at CABA and using two different sets of weighted moving averages that I like. One can use a 20 moving average as a trend line. By looking at the RSI 2 cross above the 60 line that one can get into a trend line numerous time. So what if one doesn't nail the breakout of the uptrend. They still can get in on the uptrend and make some $. BTW - the RSI 14 is showing that CABA uptrend is losing strength but it had a great run and the RSI 2 could have let anyone jump in on the uptrend. 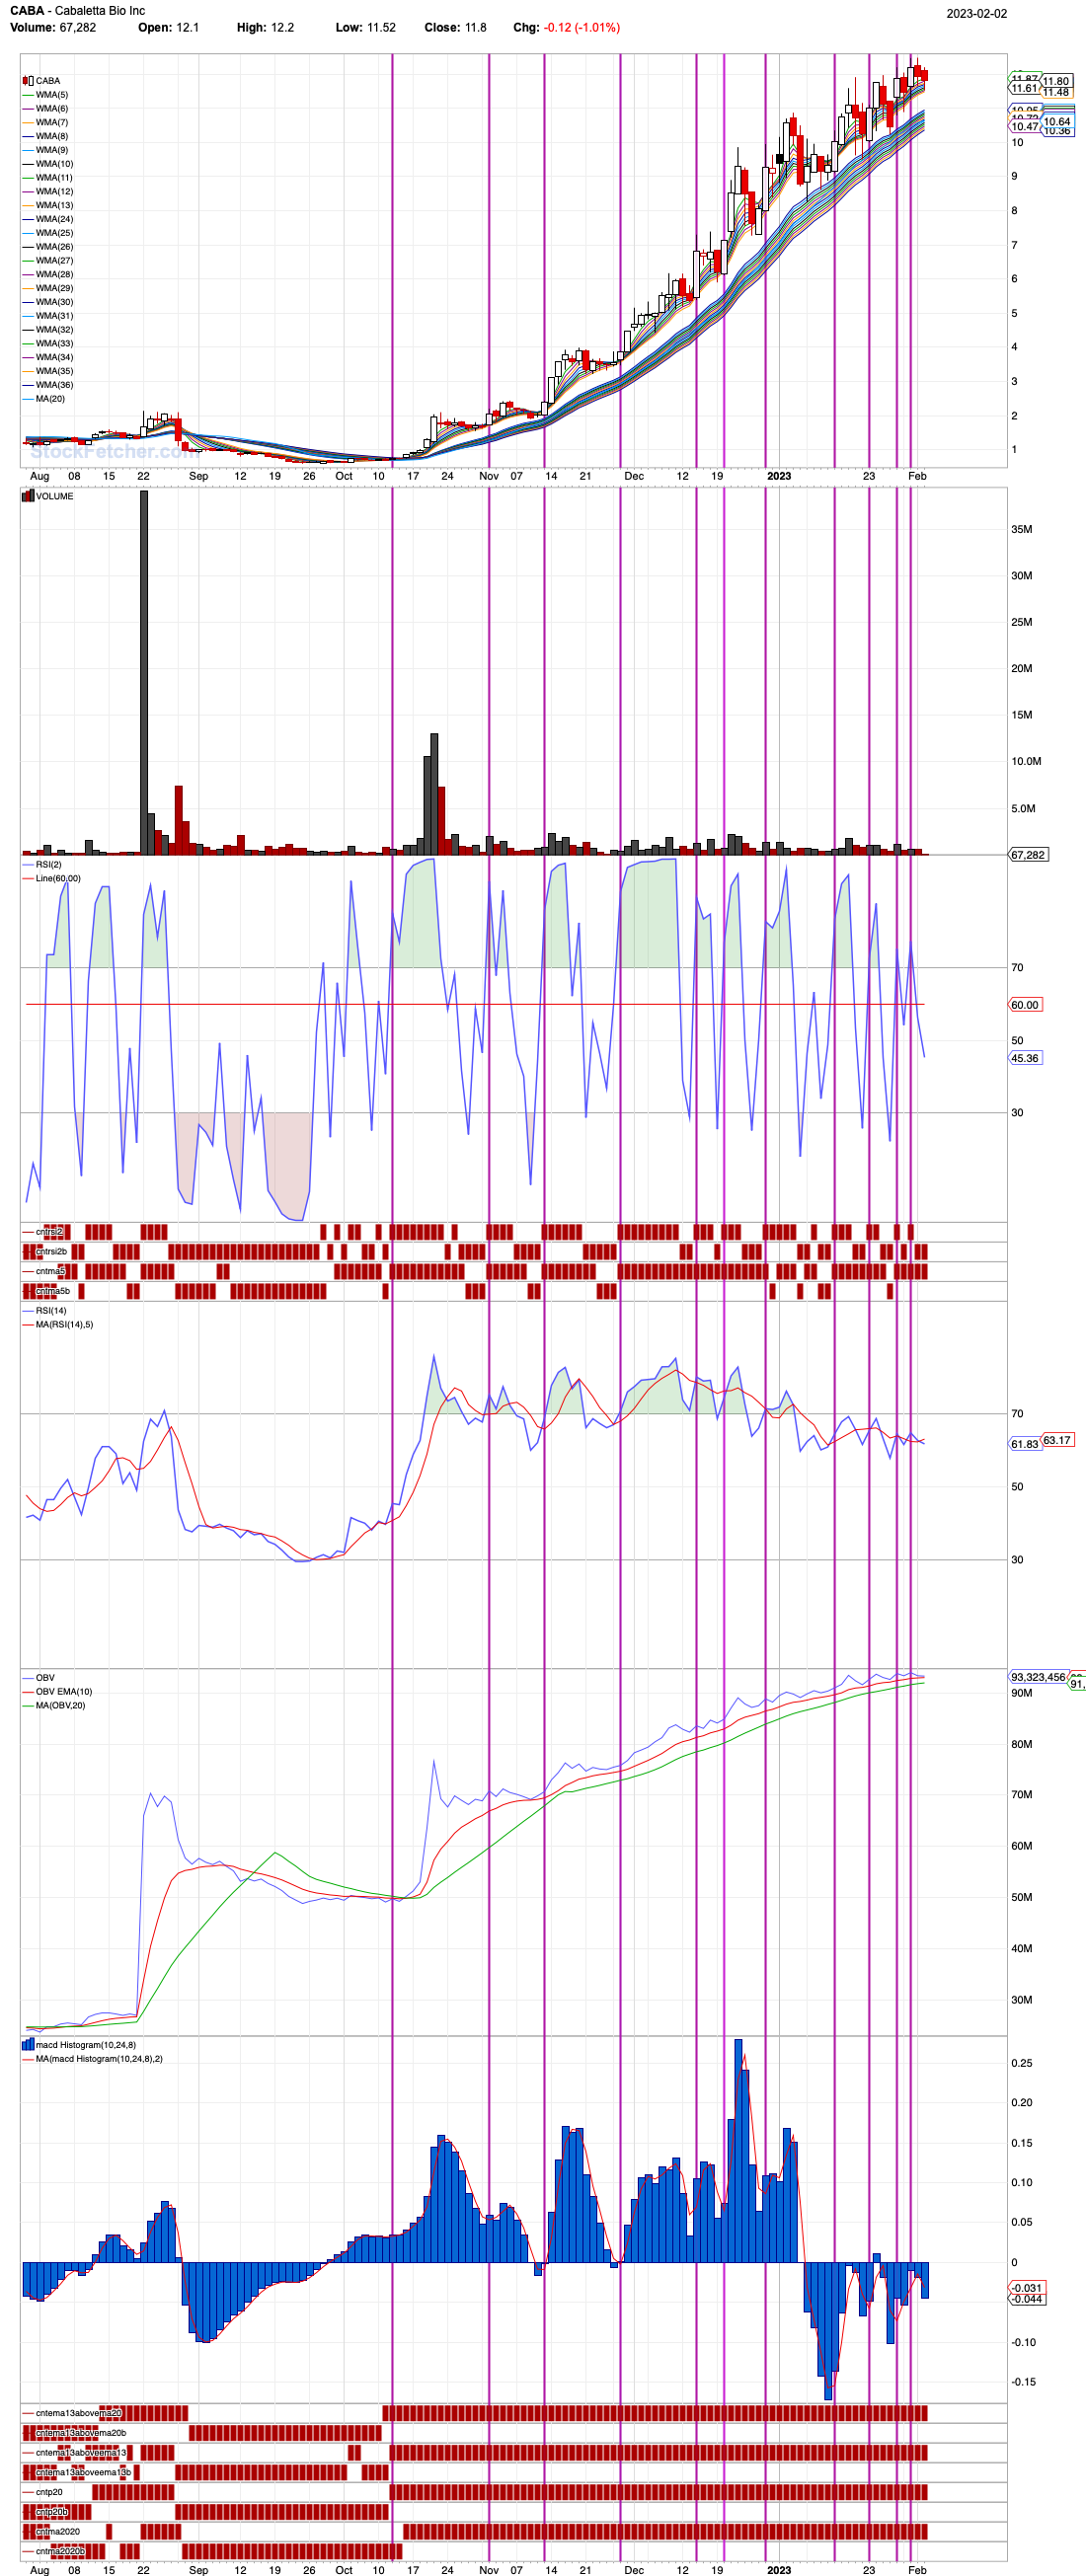 |
| nibor100 1,103 posts msg #160068 - Ignore nibor100 |
2/4/2023 4:18:28 AM @bert123, I believe the filter below(work in progress) is close to what you are after and appears to be within SF complexity limits. I have limited its output to just 4 stocks for easy testing/comparison purposes of which ACLX is one. I also expanded its backtest range to 120 days to include all of your listed trades in ACLX. Since your trades in ACLX were either 1,2, or 3 days in duration, that is all the current version is looking for and probably can be expanded without upsetting the complexity cart. Note that the total trades column will differ sometimes from the number of rsi(2) below 10 column due to the close price not getting above the ma(5) within a 3 day period. Ed S. |
| nibor100 1,103 posts msg #160069 - Ignore nibor100 |
2/4/2023 10:00:08 AM @bert123, I noticed during my testing that sometimes the RSI(2) stays below 10 for more than one day after initial cross below 10. My filter ignores those follow on days and uses the first cross below 10 as the assumed trade at the close. Is that what you do also? Thanks Ed S. |
| StockFetcher Forums · Filter Exchange · RSI 2 Bounce Filter | << 1 2 3 >>Post Follow-up |