| StockFetcher Forums · Filter Exchange · RSI(2): Nice results but no practical | << 1 2 3 >>Post Follow-up |
| WALLSTREETGENIUS 983 posts msg #62991 - Ignore WALLSTREETGENIUS modified |
5/23/2008 9:59:49 AM - DELETED BY THEMIGHTYRIGGS HIMSELF - |
| MomsLegacy 34 posts msg #63025 - Ignore MomsLegacy |
5/24/2008 1:41:01 PM ""One can never have too many homes. Especially a home where there is comfort, band aids for skinned up knees, and PB & J sandwiches! Oh yes, the finner things in life...." No kidding, Riggs. What I wouldn't do for my only worry be a band-aid and a sandwich. LOL.. Anayway, Okay... I wish I could show you my screen, but looking at your screen I'm seeing some lines that I don't know what they are. On the Rsi (2) study there is a red and a green line. What do these mean? How do I use the rsi line with these lines? on the obv there is an obv ema 100 line how do I use these together? Are these indicators set to use short term like immeidately or the next day? On my tos charts The rsi (2) study says rsi, ema (2) is that the same thing? Then it has two red lines going across at 30 and 70. OBV study only says obv no parameters and no other lines, just the values on the side. I'm sorry if this is way too elementary. I know how to use some indicators but not others. As far as RSI I would just look to see which way it was pointing then go from there. Ignorance is bliss. Ya know, the more I learn about this stuff, the only thing I seem to learn is that there's more to learn. (And it doesn't ever look like it's going to stop) And that's okay, I just gotta figure out a strategy for myself and work it so I dont' sit here for another year going in a hundred different directions. Anyway, thanks for anything you can help me with. Sorry my responses are so slow. Amy |
| WALLSTREETGENIUS 983 posts msg #63026 - Ignore WALLSTREETGENIUS modified |
5/24/2008 9:27:00 PM - DELETED BY THEMIGHTYRIGGS HIMSELF - |
| MomsLegacy 34 posts msg #63028 - Ignore MomsLegacy |
5/25/2008 12:21:33 AM Riggs, It's like having a weight lifted. As my 8 year old would say, "You rock".. Thanks. I can study now. Amy |
| maxreturn 745 posts msg #63029 - Ignore maxreturn |
5/25/2008 8:44:45 AM Riggs & Amy, the default parameter for OBV is a 10 period EMA of the OBV. The only way you can really get rid of it is to plot a 1 period EMA of the OBV. You can do this by stipulating "OBV(1)" in your code. Have a great holiday weekend! Regards Max |
| WALLSTREETGENIUS 983 posts msg #63031 - Ignore WALLSTREETGENIUS modified |
5/25/2008 9:39:44 AM - DELETED BY THEMIGHTYRIGGS HIMSELF - |
| MomsLegacy 34 posts msg #63094 - Ignore MomsLegacy |
5/28/2008 1:55:08 PM Hey Riggs, I picked a couple of good ones!! LOl.. I got puts on GFI EOD yesterday stock price 13.40 and I got rid this morning early for 13.15 but this was a really slow moving option. I thought I picked an 80 delta but, I dunno, but at least I made some, and I also picked VLO Got in EOD yesterday at 47.33 and sold this morning at 48.96. This was a good one. Getting better and better. Thanks a bunch. Amy |
| conyeuchua 83 posts msg #63133 - Ignore conyeuchua |
5/29/2008 8:51:12 PM Source: http://bzbtrader.blogspot.com/ In the May 28 and May 29, 2008 posts, bzbtrader's blog shows good back test results for using RSI(2) with IWM and QQQQ: bzbtrader's code: 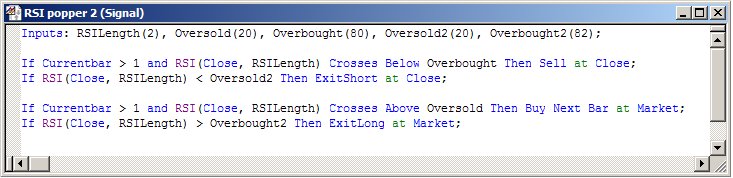
|
| StockFetcher Forums · Filter Exchange · RSI(2): Nice results but no practical | << 1 2 3 >>Post Follow-up |