| StockFetcher Forums · Filter Exchange · USE SPY CROSS AS TRADE INDICATOR | << 1 2 3 >>Post Follow-up |
| Eman93 4,750 posts msg #116640 - Ignore Eman93 |
11/9/2013 4:34:57 PM I like it... |
| Kevin_in_GA 4,599 posts msg #116645 - Ignore Kevin_in_GA |
11/9/2013 10:38:20 PM Conceptually I like this, but it backtests horribly. I mean lousy - only 42% win rate, and depending on your selection method either a losing strategy or barely breakeven from 9/2008 through the end of October. Better settings - reverse the entry strategy (cross below rather than cross above) and use MA(5) - MA(15) crosses below CEMA((MA(5) - MA(15)),17). Exit on the cross above. That combination returned a CAGR of 24% (versus only 6.44% for the ^SPX), a win rate of 65.18% on 741 trades. Portfolio size of 5, fixed trade amount of $20,000, includes slippage and commissions. Not the best system I've seen, but pretty solid and it returned more than my feeble attempts during the early part of that period. This is why you should never have an opinion about a system solely from looking at a few charts. BACKTEST. |
| alf44 2,025 posts msg #116652 - Ignore alf44 modified |
11/10/2013 6:19:49 PM ... I just wonder if ANYTHING "backtests" well ??? ----- I am certainly no expert on the whole exercise of running extensive backtests on these scans or trading strategies ... but, it seems that very few (if ANY) of them EVER hold up well to that whole process ... whatever THAT "process" is ! Is it the strategy ? Is it the backtest ? ----- Perhaps ... "It's NOT what you trade ... it's HOW you trade it !" LOL . |
| Kevin_in_GA 4,599 posts msg #116653 - Ignore Kevin_in_GA |
11/10/2013 7:14:33 PM A good backtest is like a good foul shooter at the line. A bad backtest is like a bad foul shooter. Past performance is no guarantee of the future, but often it is a pretty good indicator of how things are likely to turn out. If you want to score those foul shots, who do you want at the line? Jordan or Rodman? |
| alf44 2,025 posts msg #116654 - Ignore alf44 modified |
11/10/2013 7:46:00 PM ... not sure ! But, I'm pretty certain I don't want Dwight Howard ! Just sayin' ... . |
| alf44 2,025 posts msg #116680 - Ignore alf44 modified |
11/11/2013 9:49:08 PM . "A good backtest is like a good foul shooter at the line." ----- A "good backtest" ... is ALSO like BIGFOOT !!! Some people claim to have seen it ... but, I remain skeptical !!! . |
| Sqwii 160 posts msg #116696 - Ignore Sqwii |
11/12/2013 4:52:33 PM Alf Interesting filter. What is the most important on those signals ? The MA 16 upper indicator or EMA(15) ? When do you think it is a "buy" and "sell" when both inlignement ? |
| alf44 2,025 posts msg #116704 - Ignore alf44 modified |
11/12/2013 8:54:34 PM "Sqwii" ... ----- "Interesting filter. What is the most important on those signals ? " ----- I didn't really post that as a "filter" ... I meant it to be a comparison between the two ! While I like four's idea (basically it is the SPY'S LOWS vs. an average of the SPY's LOWS) ... the intent of MY post was ... ... to show that a simple (3,10,16) Simple Moving Average Price Oscillator (of the SPY, DIA, QQQ etc...) ... accomplishes the same thing ... AND ... maybe better ! IMHO . |
| agavaqif 8 posts msg #117595 - Ignore agavaqif |
1/3/2014 3:52:13 AM Hi guys .. I am sorry but I am not very familiar with coding of StockFetcher( I am new). Can anyone explain what does this filter mean? Thanks |
| four 5,087 posts msg #117597 - Ignore four modified |
1/3/2014 10:54:36 AM agavaqif, Welcome. Do download the user guide and walk through the basics of using StockFetcher. Here is the link to the guide: User Guide ------------------ I repost the my original filter (below the YUM chart) here and this thought: 1. The premise is that a stock in the SP500 is traded if the SPY is above its own moving average (LONG), The reverse for a SHORT. 2. The stock is traded with the CCI(15) indicator. LONG -- Wait for the CCI(15) < 0. My usual preference is to buy the High + a few pennies over the trigger day price with a stoplimit order. Won't always get in but that is "my way". Here is a picture of what probably would be considered successful -- LONG stoplimit = 72.95 on Dec 19 -- (if held until today). As others know on this board, my missing link is the EXIT strategy for a win or a loss. And of course (as posted in the past) I prefer dividend paying stocks. The stock below (YUM) is about a 2% dividend. 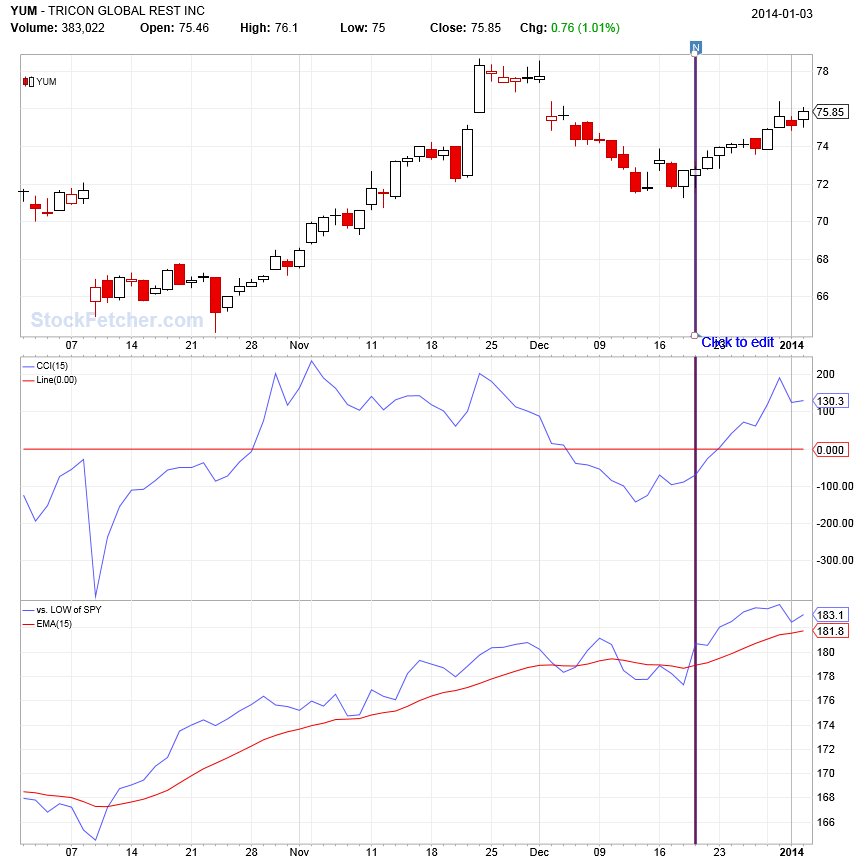 |
| StockFetcher Forums · Filter Exchange · USE SPY CROSS AS TRADE INDICATOR | << 1 2 3 >>Post Follow-up |