| StockFetcher Forums · General Discussion · Affixed Yellow shaded measurements tags on the right side of new chart are obstruction | << >>Post Follow-up |
| Longhaily 61 posts msg #116810 - Ignore Longhaily |
11/16/2013 8:56:32 PM Hello SF Your yellow shaded measurement tags on the right side of new charts obstructed live tags when I hover the crosshair over individual indicators. I can't read the readings of the live tags because they appeared BEHIND your affixed yellow shaded tags ? |
| alf44 2,025 posts msg #116811 - Ignore alf44 modified |
11/17/2013 12:26:58 AM ... agree completely !!! ---- Not sure what the solution is ... if you have "lines drawn on indicators" ... "zero lines" ... "OB/OS" ... "MAs" ... etc ... It can git pretty crowded OVER THERE ... on the "Hard Right Edge" !!! JUST SAYIN' !!! . |
| alf44 2,025 posts msg #116812 - Ignore alf44 modified |
11/17/2013 12:45:22 AM . ... and ... SPEAKIN' of the "Hard Right Edge" ... it would ALSO be REALLY nice ... to be able to "nudge" the Price plot and (of course) ... the Lower Indicator plot ... TO THE LEFT ... "X" amount ... so that EVERYTHING ISN'T CRUSHED UP AGAINST THE RIGHT SIDE !!! --- Allow US to create some "daylight" between the LAST "price" candle / etc ... plotted ... and the Right Edge !!! TIA ! . |
| stockfetcher 980 posts msg #116814 |
11/17/2013 9:10:37 AM Hi, We have made some changes to the markers. While still not perfect it should help a bit. The changes include: - Fix issue with hover marker below other markers. - Color code marker borders to series color - Shift some markers to improve readability. 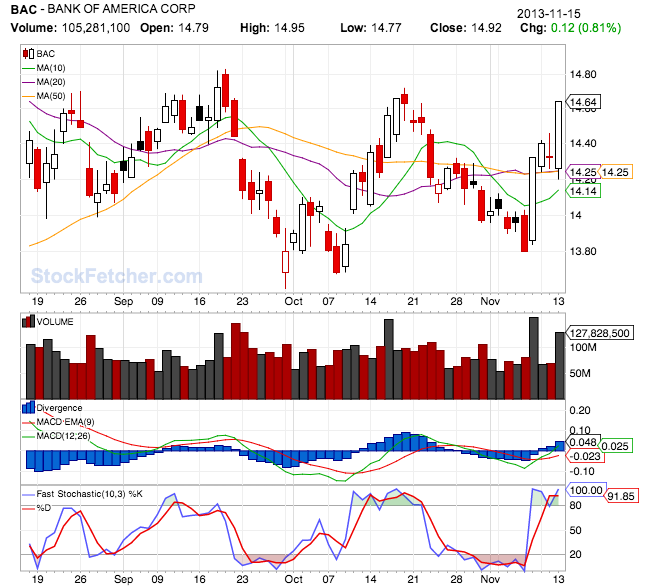 @alf44 - we're looking into your suggestions with respect to the right spacing. Thanks, StockFetcher.com Support |
| Kevin_in_GA 4,599 posts msg #116815 - Ignore Kevin_in_GA |
11/17/2013 10:43:15 AM Why not just put the value in the upper left corner next to the indicator name? Plenty of room there and it makes sense. |
| stockfetcher 980 posts msg #116817 |
11/17/2013 12:20:54 PM @alf44 - We have implemented your request to allow space between the last value and the edge of the plot. Just hold the mouse button down and drag to the left to create the space.  @kevin_in_ga: Great suggestion. We'll add a user preference to move the values next to the legend items. Thanks, StockFetcher.com Support |
| alf44 2,025 posts msg #116818 - Ignore alf44 |
11/17/2013 2:38:19 PM ... I'm not hatin' it ... kewl !!! TYVM !!! . |
| marine2 963 posts msg #116819 - Ignore marine2 |
11/17/2013 4:05:18 PM On chart created while I am in the "backtest" section, why not box in "yellow" or hightlight the whole box in "yellow" the price value (off to the right side of the chart) showing what the price value is when you put your cross hairs on a particular spot on the chart? Right now when I do that the box, showing its price, over at the right side (indicating my cross hair fix on the chart) is a black box with a black color numeral to which blends in with other black box and its numeral showing the last days closed price value. If you could please put in color the whole box "yellow" or highlight it in "yellow" indicating what price value the cross hair is currently showing. It would help us see this cross haired price value much better. I use this particular cross hair function in finding what price value I would have had if I would have bought or sold at that point. Thank you. |
| StockFetcher Forums · General Discussion · Affixed Yellow shaded measurements tags on the right side of new chart are obstruction | << >>Post Follow-up |