| StockFetcher Forums · General Discussion · Breakout Trading Webinar (Kunal Desai) - owner of BullsonWallstreet. | << 1 2 3 4 >>Post Follow-up |
| Mactheriverrat 3,178 posts msg #154727 - Ignore Mactheriverrat |
11/23/2020 6:42:49 PM Yes yesterday BB was at resistance but fail to break through just KIRK was at resistance or there at. My filter , the finviz filter . It broke out today. Just because its at resistance doesn't mean its a sure thing to break out tomorrow. KIRK breakout today and will most likely run for some days to come. 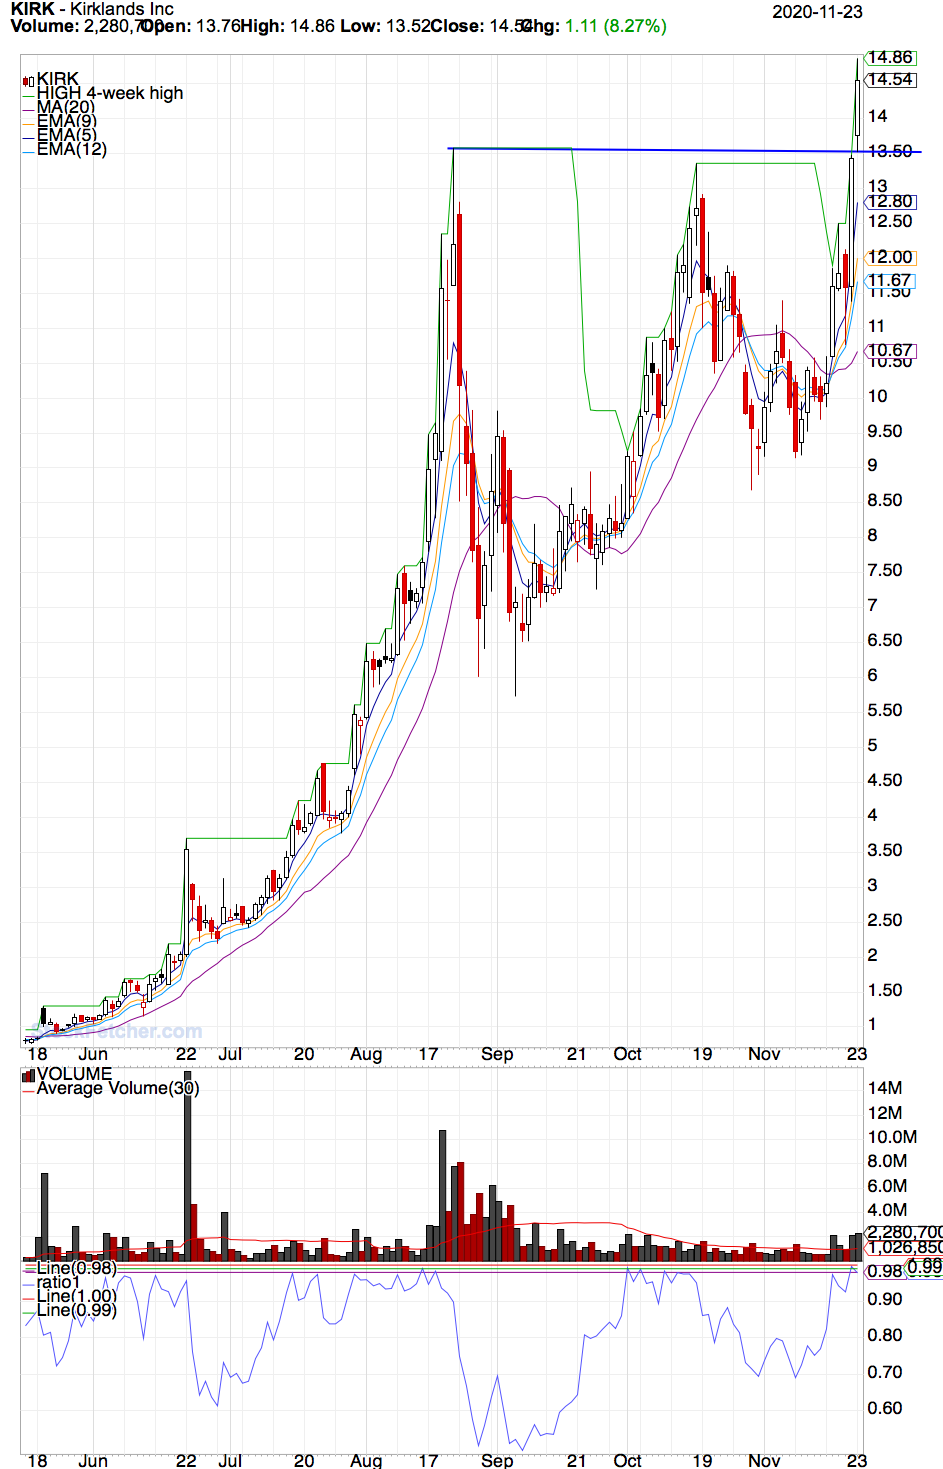 |
| Mactheriverrat 3,178 posts msg #154728 - Ignore Mactheriverrat |
11/23/2020 6:49:16 PM |
| Mactheriverrat 3,178 posts msg #154753 - Ignore Mactheriverrat |
11/26/2020 9:54:58 AM |
| Mactheriverrat 3,178 posts msg #154754 - Ignore Mactheriverrat |
11/26/2020 9:59:53 AM My WPG trade. 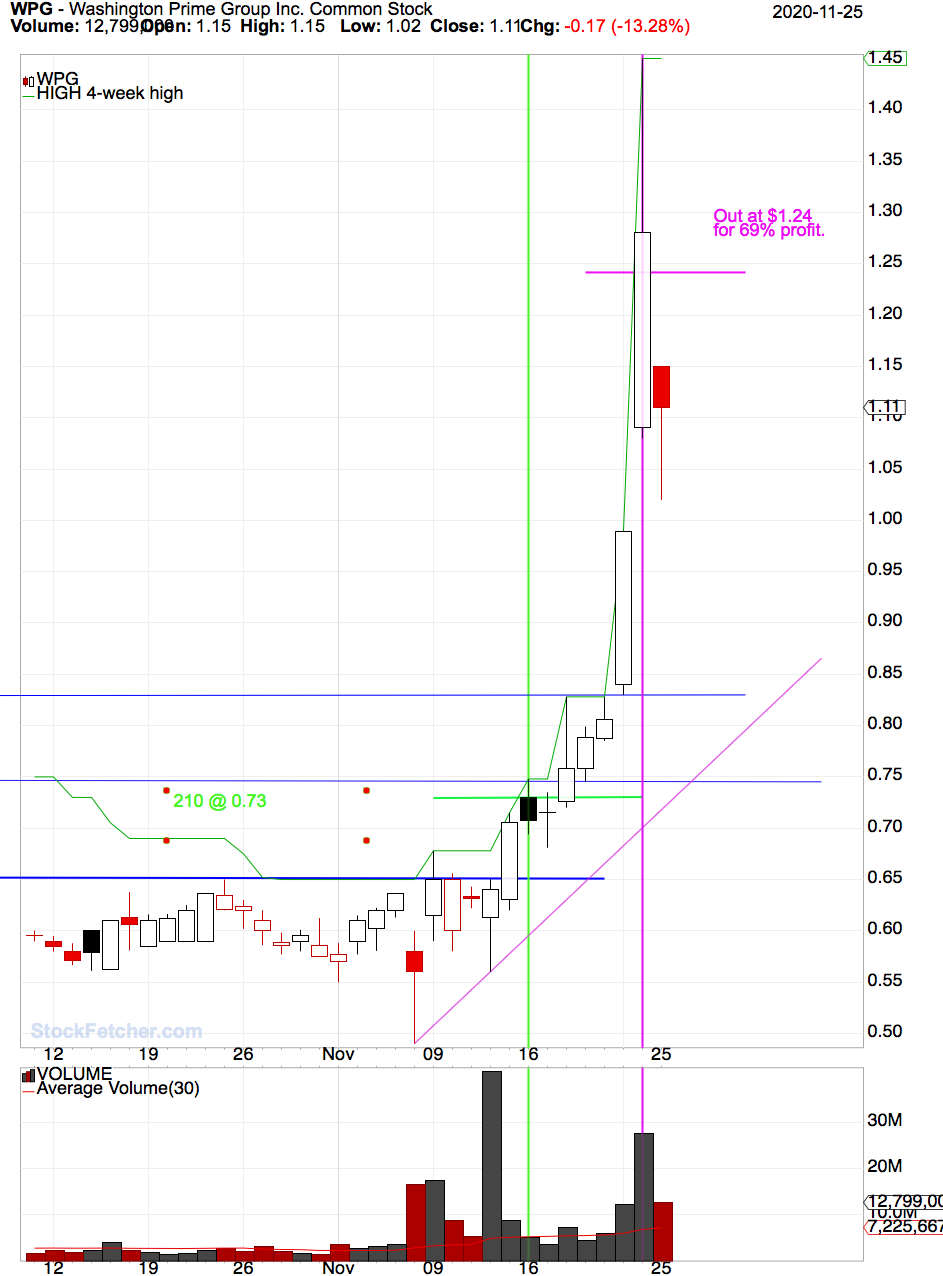 |
| Mactheriverrat 3,178 posts msg #154771 - Ignore Mactheriverrat |
11/29/2020 2:49:03 PM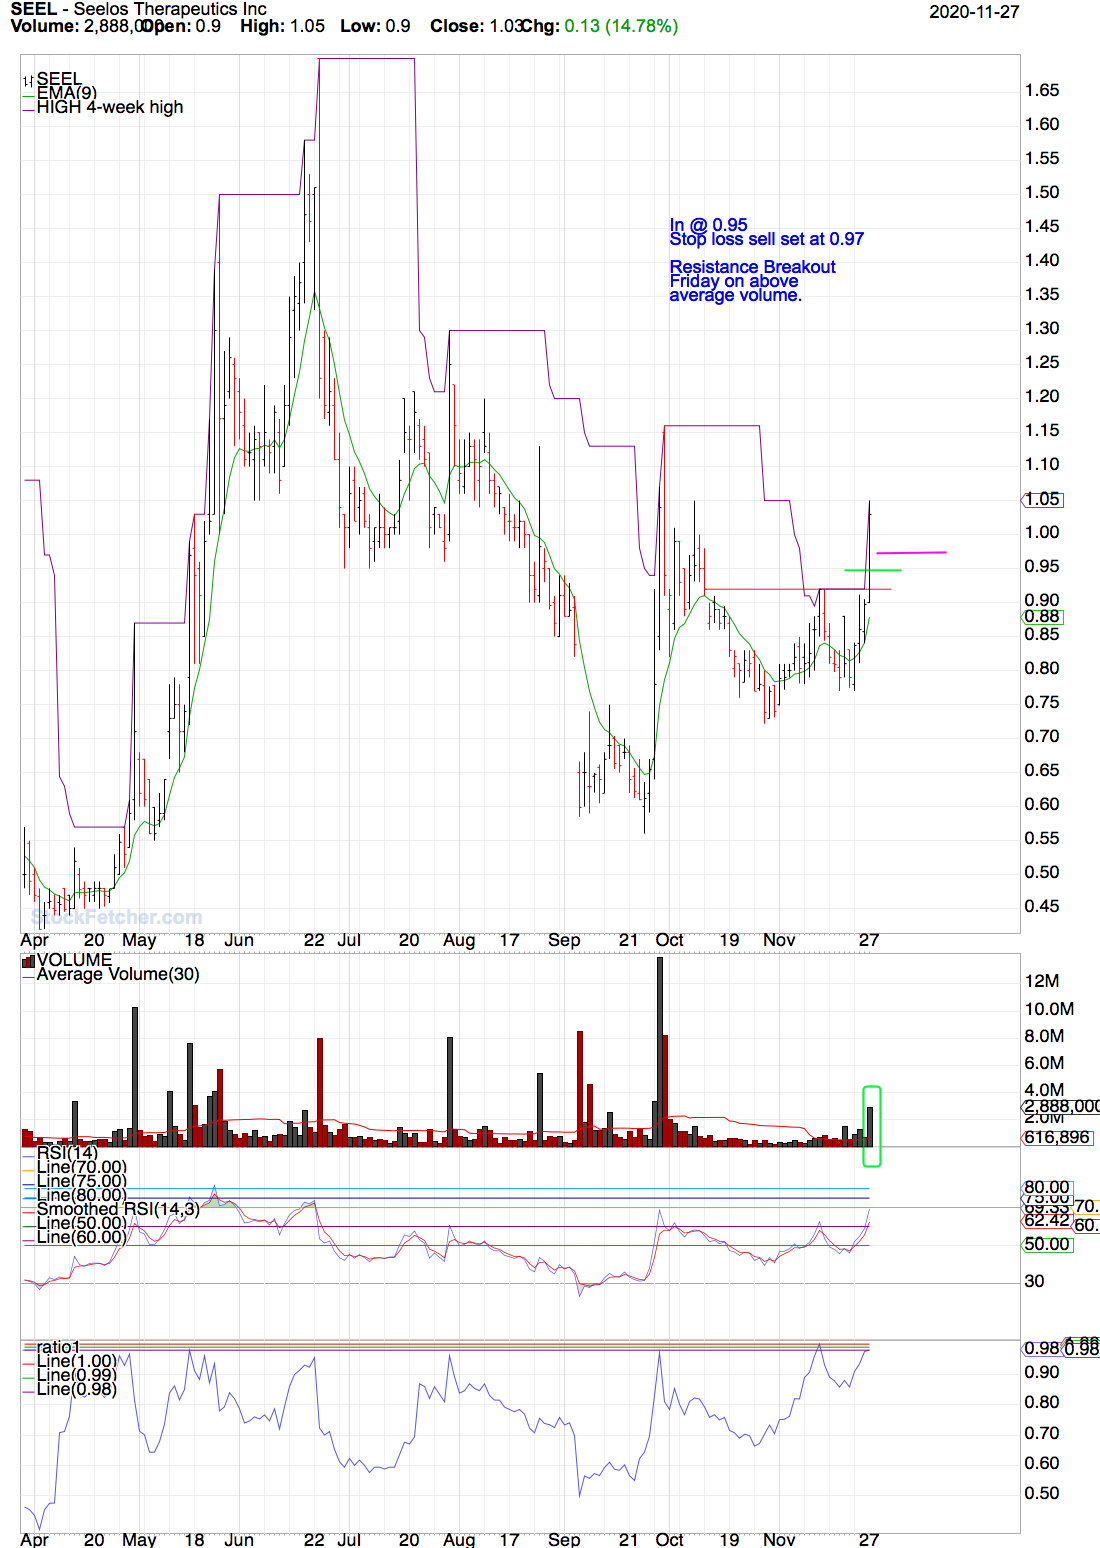 |
| Mactheriverrat 3,178 posts msg #154772 - Ignore Mactheriverrat |
11/30/2020 10:54:04 AM Stop loss triggered SEEL |
| Mactheriverrat 3,178 posts msg #154836 - Ignore Mactheriverrat |
12/5/2020 1:00:57 PM Kunal's Video minus the indicators is a great video . IMHO. Another old SF poster once stated " There's always a Bull Market somewhere"  |
| Mactheriverrat 3,178 posts msg #154840 - Ignore Mactheriverrat |
12/6/2020 12:32:28 PM So many pre-breakouts and post breakouts to watch. |
| nibor100 1,103 posts msg #154898 - Ignore nibor100 |
12/11/2020 11:31:26 AM @Mac, I finally got around to watching the breakout video and I've got a couple of questions: 1. Looks like it was made in 2010, have you had it that long or did you just recently come across it? 2. In your related filters you are using 4 week highs, yet in his video I only hear him talking about 4 taps of resistance lines, and also a 4% price increase rule. How did you come up with using 4 week highs? Thanks, Ed S. |
| Mactheriverrat 3,178 posts msg #154901 - Ignore Mactheriverrat modified |
12/11/2020 1:47:31 PM @ED Well I downloaded about around about the time it was posted. I was messing around on my laptop and came across it again. I watched it and searched for the link and found it. You know the old saying " Find something that works until you find something that works better". I more or less use the 4 week high as helping see the previous resistance area's . Taps meaning that the more times price hits a previous resistance the weaker that resistance gets. 4% rule means that most big moves of breakouts start with a breakout over the the previous resistance levels . That's not saying that a stock needs to have a gain of 4% to be a breakout. My chart with CDEV shows previous resistance levels that might have been previous support levels. Those levels are not going to be pin point at the exact point but areas of congestion where the Bulls and Bears are fighting for control. Some time's either side can win the battle but see the above average volume's pick up at after the breakout. Take any stock on a simple chart like I made up and add say 10 stocks. Draw all previous resistance and support levels. You major levels along with mini- levels too. Like the maker of the video said the market remember past area's of congestion. By the same token look when those same stocks are in downtrends and what happens after they break area's of support. Most of the time you will see a somewhat of increase in volume as price breaks below previous levels. See all traders everywhere see the same daily price and volume action. Its what we do with that information that make's the difference.  |
| StockFetcher Forums · General Discussion · Breakout Trading Webinar (Kunal Desai) - owner of BullsonWallstreet. | << 1 2 3 4 >>Post Follow-up |