shillllihs
6,102 posts
msg #129044
- Ignore shillllihs
modified |
6/9/2016 8:59:57 PM
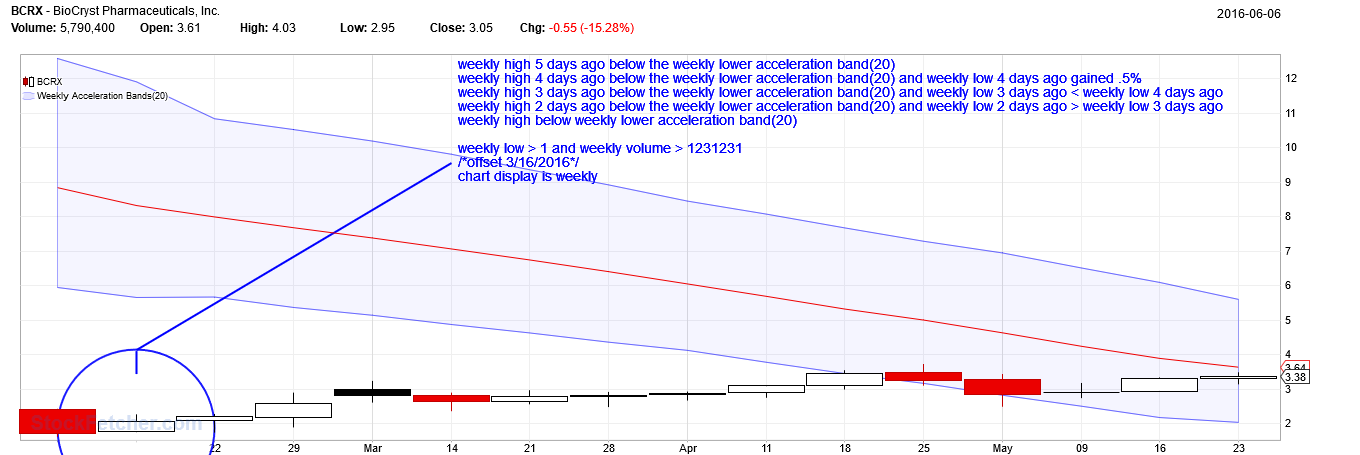
I want to see,
At least 1 candle completely below the lower weekly acceleration band(20)
Then a candle encroaching the lower weekly acceleration band(20)
followed by another candle completely below lower weekly acceleration band(20)
followed by another encroaching candle of the lower weekly acceleration band(20)
Candles don't have to occur within 4 days, may be under or over for several days
but looking for this setup.
|