| StockFetcher Forums · General Discussion · I've asked this before with no luck | << >>Post Follow-up |
| zaq777 19 posts msg #142421 - Ignore zaq777 |
2/23/2018 2:16:56 PM Will try again hopefully someone knows. Suppose you have two lines (for example a moving ave. and a Bollinger band) on a chart and while might you want to see the price close above both for the first time, that doesn't always happen. Sometimes it will cross one and then the other a day or two later. So how do I construct a search for both happening together for the first time within a certain period of time without regard to which happens first? |
| four 5,087 posts msg #142422 - Ignore four modified |
2/23/2018 3:01:35 PM https://www.stockfetcher.com/sfforums/?mid=122375 OR 1st chart: no look back -OR- 2nd chart look back and line drawn to identify location easier  OR 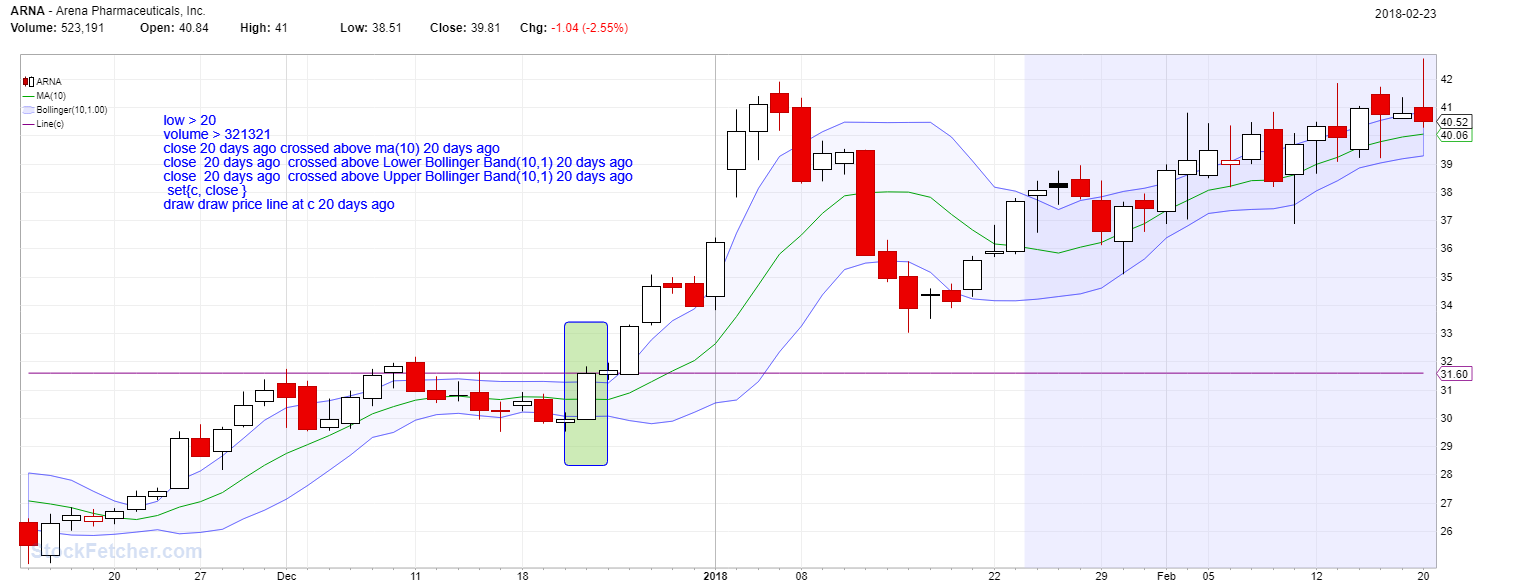 |
| olathegolf 119 posts msg #142438 - Ignore olathegolf |
2/24/2018 5:25:18 PM zaq777, Is this what you're looking for? Just edit the number of lookback days. |
| zaq777 19 posts msg #142445 - Ignore zaq777 modified |
2/25/2018 9:13:10 AM A better way of putting the question. How do I find when two or more indicators or situations on a chart coincide for the first time in a set number of days? Did x AND y happen today? Yes Did x AND y happen yesterday or any other day recently? No Did x happen before today? Maybe Did y happen before today? Maybe I haven't yet tried the current suggestions and will tomorrow. |
| olathegolf 119 posts msg #142449 - Ignore olathegolf |
2/25/2018 3:38:26 PM Try this one. I think it's what you had in mind. Nice little filter for breakouts. Pop..... |
| olathegolf 119 posts msg #142450 - Ignore olathegolf |
2/25/2018 3:44:54 PM I saw that mahkoh posted on your other discussion post. I agree that your best to look back at filters from other members. You'll learn fastest that way. Kevin_in_GA is no longer on SF but you'll find his work to be an encyclopedia of useful information. He also organized things so his filters are easy to follow. |
| zaq777 19 posts msg #142462 - Ignore zaq777 modified |
2/26/2018 9:05:24 AM I see his answer from 2014 was good after all. I misremembered that. Thanks. The problem for me is how incomprehensible the advanced format is. Thank you everyone who gave it a shot. |
| StockFetcher Forums · General Discussion · I've asked this before with no luck | << >>Post Follow-up |