| StockFetcher Forums · General Discussion · OKAY ! So you've been sentenced to 10 years in prison ... | << >>Post Follow-up |
| alf44 2,025 posts msg #117103 - Ignore alf44 modified |
11/27/2013 11:49:51 PM . .................... 
...........................................For A Brutal Attack On Bernie Madoff !!! Forensic Investigators proved conclusively that your DNA (and fingerprints) were ALL OVER a nearby can of Gillette Shave Cream !!! ----- You are NOW on guarded watch and you've been separated from the general prison population for your own safety. You are given 90 minutes a day outside your 8' x 10' cell ... for exercise, a shower and ... a bit of TV (which you use by catching the OPEN, HIGH, LOW, CLOSE of the SPY on CNBC ! OH ... and ONE PHONE CALL ! That's it and it's back to your prison cell ... "tough guy" ! ----- Back ... safely in your private cell you have a bed of course ... the requisite toilet etc ... but, you've also been allowed a small desk and chair. Each afternoon when you return to your cell you sit at your desk with a tablet of graph paper, a pencil and a make-shift straight edge. NO calculator ... NO computer ... NO Charting Program ... and needless to say ...NO StockFetcher !!! JUST ... graph paper, a pencil and a make-shift straight edge !!! ----- You know the procedure well ... you know the simple formula by heart ... You take the daily HIGH LOW CLOSE of the SPY that you heard earlier on CNBC ... You then calculate the "Daily Pivot" of the SPY ... You then take that NEWEST Daily Pivot ... and add IT to the list of the previous Daily Pivots ... You then create a list of the 10 most recent Daily Pivots ! You then add them all together and divide the sum by 10 ... creating a 10 day Simple Moving Average of Daily Pivots ! You first plot TODAY's CLOSE on the sheet of graph paper you have been carefully maintaining each day ... THEN you plot TODAY's 10 day Simple Moving Average Daily Pivot number that you just calculated ... onto your plot of daily CLOSES ! You then ... just as you've done many times before ... simply join the dots with your "make-shift" straight edge ! YOU'RE DONE !!! ----- 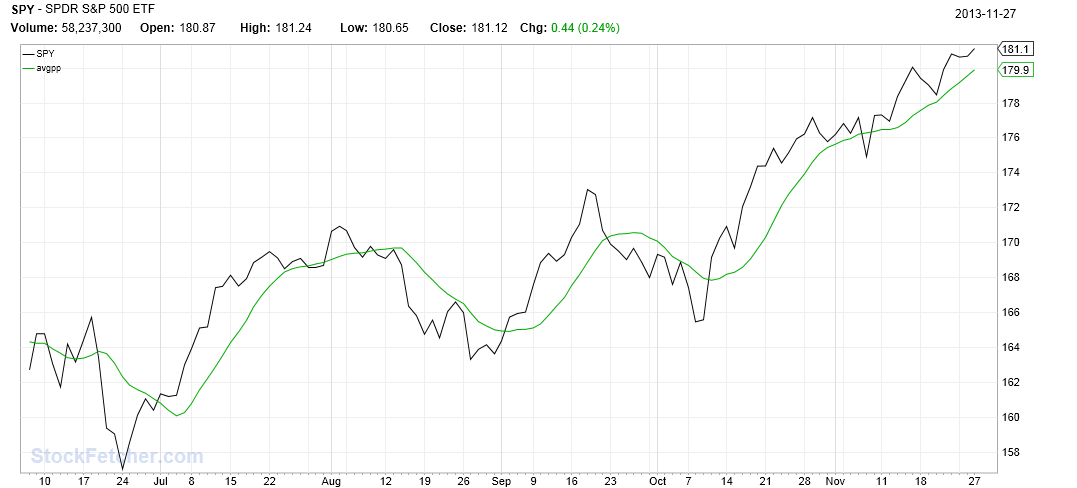 ----- Tomorrow, during your 90 minutes of "freedom" ... you will do it ALL again ... AND you will use your 1 phone call to dial up your Broker with BUY/SELL instructions !!! You Will ... BUY (COVER) the SPY on a Close ABOVE the 10 SMA of the Daily Pivot ... SELL (SHORT) the SPY on a Close BELOW the 10 SMA of the Daily Pivot ... ----- Using this simple little "system" you've devised ... you hope to have a nice little "stash of cash" when get out of the "Big House" !!! . |
| Kevin_in_GA 4,599 posts msg #117104 - Ignore Kevin_in_GA |
11/28/2013 9:24:09 AM Sounds familiar ... http://stockfetcher.com/forums/Filter-Exchange/FILTER-BASED-ON-MOVING-AVERAGES-OF-PIVOTS/84053/0 |
| alf44 2,025 posts msg #117110 - Ignore alf44 modified |
11/28/2013 7:30:31 PM . Moving Averages of Pivots / Supports / Resistance Levels are NOT anything new ! Certainly, didn't mean to imply that I'd somehow invented something never before seen ! ... (although, I must confess ... never before have I seen your thread) ... ----- The point of the post was that ... god forbid ... should you find yourself without the "charting luxuries" we all take for granted ... ... that EVEN WITH ... just a pencil ... graph paper and ... some basic info ... it's "possible to trade" !!! And, not only "trade" ... but, "trade" reasonably well (even in "hypothetical" prison) !!! LOL ----- Also, that sometimes we forget that some of the EARLY greatest traders of all time ... plotted their own charts by hand !!! They didn't depend on the endless library of oscillators and arcane indicators ... that WE are all overwhelmed with today !!! They didn't have ANY of that stuff !!! They had a pencil ... and ... some graph paper ... and, some understanding of Price Action !!! . |
| Kevin_in_GA 4,599 posts msg #117111 - Ignore Kevin_in_GA modified |
11/28/2013 7:44:23 PM With a pencil and paper you could do quite well, even if all you did was buy or sell based on the moving average of the typical price (e.g., (H+L+C)/3). |
| alf44 2,025 posts msg #117112 - Ignore alf44 modified |
11/28/2013 7:46:09 PM . I completely agree !!! And, THAT was my point !!! . |
| alf44 2,025 posts msg #117114 - Ignore alf44 modified |
11/28/2013 10:54:08 PM . NOW !!! If you don't mind !!! Excuse me ... while I get back to being overwhelmed by my arcane Technical Indicators !!! ----- I'm currently working on implementing ... ... an 8 period Custom RSI ... ... of an 8 period R-squared ... ... of an 8 period Double Smoothed TRIX !!! ----- And, you think I'm kidding ??? ----- Okay, I'm kidding ... SORTA ... !!! . |
| marine2 963 posts msg #117124 - Ignore marine2 |
11/29/2013 3:06:19 PM My earlier way before our ever abundant filtering tools we now have the luxury of using, I was playing a simple method of, if the stock price moved up 3 consecutive days and if this particular stock was in my "circle of financial gems" I would then buy some shares. Of course, I would never intend buying anything before the market atmosphere was showing "green" light. Another earlier method was, when charts would show a stock price crossing above MA(50) line I would consider buying it. Again, only using stocks inside my "circle of financial gems". How far we have come since the early days. |
| StockFetcher Forums · General Discussion · OKAY ! So you've been sentenced to 10 years in prison ... | << >>Post Follow-up |