| StockFetcher Forums · General Discussion · Question for Stockfetcher folks | << 1 2 >>Post Follow-up |
| SAFeTRADE 660 posts msg #117001 - Ignore SAFeTRADE |
11/23/2013 2:13:46 PM Stockfetcher why aren't the two lines labeled in the top left hand corner. They used to be. It gets quite confusing when there is more than 1 line or indicator being drawn. 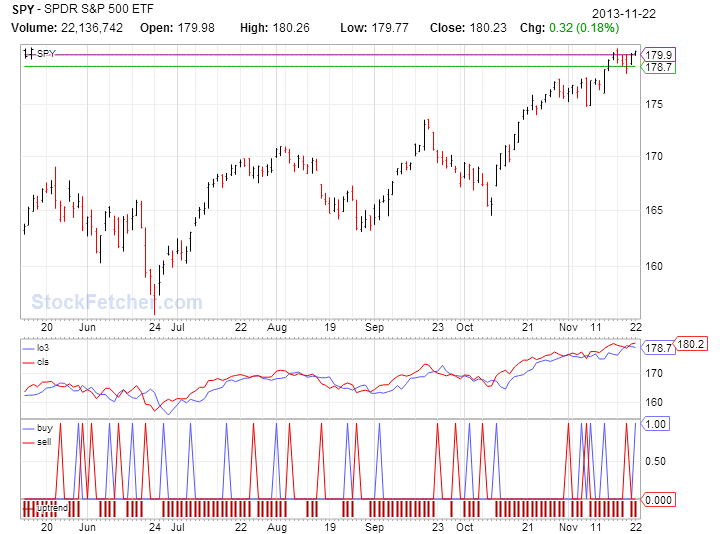 |
| stockfetcher 980 posts msg #117022 |
11/25/2013 10:08:15 AM If possible, can you provide the filter syntax that generated the chart that you mention? Thank you, StockFetcher Support |
| SAFeTRADE 660 posts msg #117036 - Ignore SAFeTRADE |
11/25/2013 6:34:24 PM It is as follows; draw price line at low 3 days ago draw price line at high 3 days ago set{buy, count(close Crossed above high 3 days ago,1)} set{sell, count(close crossed below low 3 days ago,1)} set{uptrend, count(close = > low 3 days ago,1)} symlist(spy) set{cls, close} set{lo3, low 3 days ago} draw cls on plot lo3 |
| dangreene 229 posts msg #117037 - Ignore dangreene |
11/25/2013 7:40:16 PM SAFeTRADE, NICE ! Thanks |
| SAFeTRADE 660 posts msg #117081 - Ignore SAFeTRADE |
11/27/2013 9:48:53 AM I am still waiting for a resolution to my question regarding labels of lines. |
| stockfetcher 980 posts msg #117082 |
11/27/2013 9:52:48 AM Hi, We are still looking into this. We will let you know as soon as it's resolved. Thanks, StockFetcher.com Support |
| stockfetcher 980 posts msg #117085 |
11/27/2013 11:59:25 AM Hi, We're still running through some tests but is this about what you had in mind? 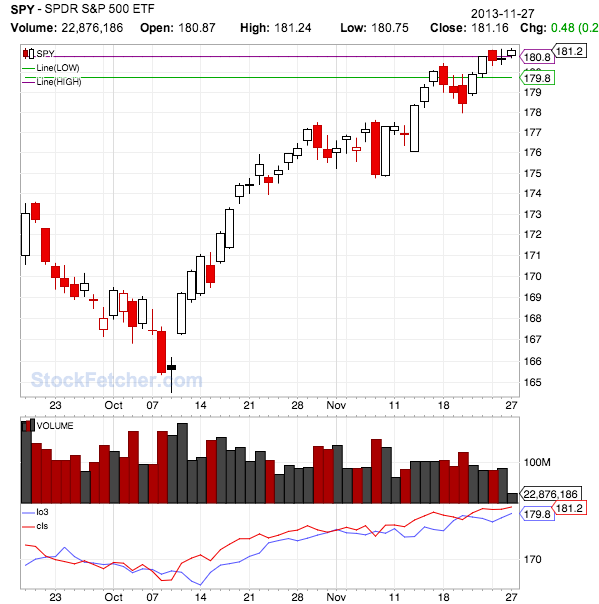 For: |
| alf44 2,025 posts msg #117088 - Ignore alf44 modified |
11/27/2013 12:32:35 PM . ... if you add the "draw uptrend" (close equal or greater than LOW 3 days ago) set statement ... and ... "draw sell on plot buy" ... you see this ! --- 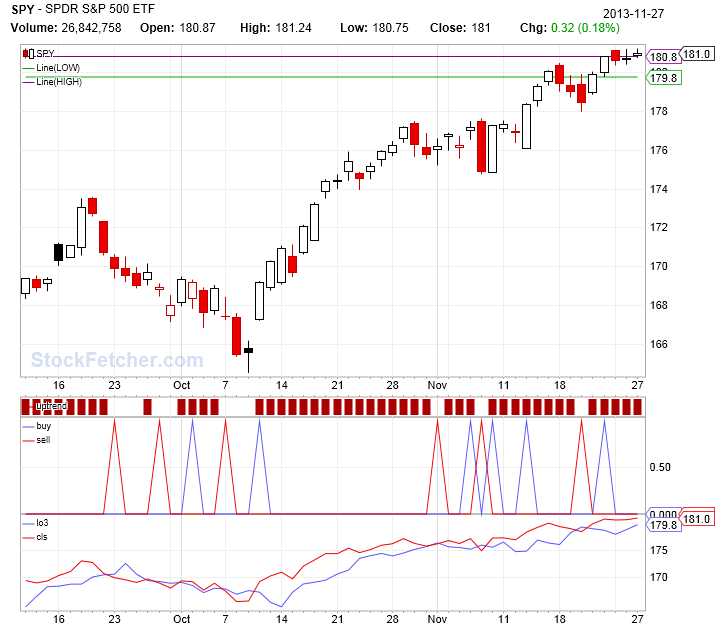 --- . |
| SAFeTRADE 660 posts msg #117093 - Ignore SAFeTRADE modified |
11/27/2013 1:22:32 PM That is what I am looking for Stockfetcher, but it should plot any other indicators I would like to plot on the chart... as it did in the old days. Thank you for your quick attention to this matter. Should not the top most line be notated first followed in sequence by the next lowest line. |
| SAFeTRADE 660 posts msg #117095 - Ignore SAFeTRADE modified |
11/27/2013 1:32:29 PM Very nice ...ah-hem...modification.. ALF44. Allows everything to appear...in Sync and visually it is... more....OBVIOUS AS TO TREND AND BUY AND SELL SIGNALS.. Thank You ALF44! |
| StockFetcher Forums · General Discussion · Question for Stockfetcher folks | << 1 2 >>Post Follow-up |