| StockFetcher Forums · General Discussion · Question for Stockfetcher folks | << 1 2 >>Post Follow-up |
| SAFeTRADE 660 posts msg #117269 - Ignore SAFeTRADE |
12/6/2013 4:35:54 PM We are getting closer. However the 20 day high does not change as we move back in time. The low_day is correct as we move back. The 20 day high stays current. Is there a way to address that. In other words can it pick up the previous 20 day high and the one before that as we move back in time? Clarence |
| stockfetcher 980 posts msg #117270 |
12/6/2013 4:42:32 PM If possible, can you provide more details concerning the "moving back" issue? Are you referring to the "date offset" command? StockFetcher Support |
| SAFeTRADE 660 posts msg #117271 - Ignore SAFeTRADE |
12/6/2013 4:42:46 PM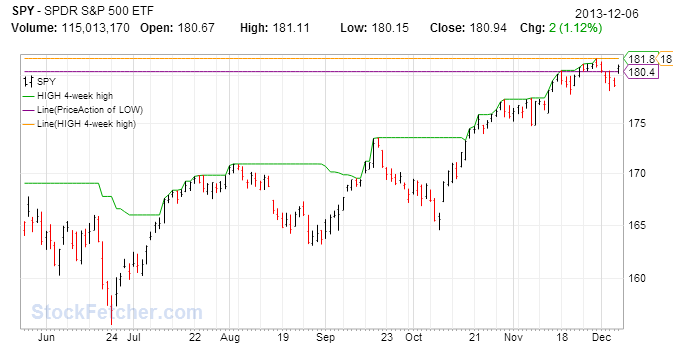 Can we get it to follow the 20 day high as it unfolds on the following chart. I hope this is a little more understandable. Picture is worth a thousand words someone said. Clarence |
| stockfetcher 980 posts msg #117272 |
12/6/2013 4:51:38 PM The prior example was intended to show the current values as lines on the chart. The example below may provide a closer match to the chart you are interested in: StockFetcher Support |
| SAFeTRADE 660 posts msg #117273 - Ignore SAFeTRADE |
12/6/2013 6:33:08 PM Thank you Stockfetcher, I believe that hits the spot. If I have any more questions, I will give a holler. Clarence |
| alf44 2,025 posts msg #117276 - Ignore alf44 |
12/6/2013 11:40:21 PM . "Clarence" ... WHAT ... do you have up yur sleeve ? --- Hmmm ... . |
| SAFeTRADE 660 posts msg #117279 - Ignore SAFeTRADE modified |
12/7/2013 4:00:44 PM ALF44, This is what I have been working on with a lot of help from the Stockfetcher folks. It is based on your Three-Bar Net Line idea. Not sure if it can be successfully coded from our side of the screen. But, this is my best shot at it to date. I have tried to incorporate inside days as the rules state, however because I don't have the advanced subscription I can't run it with the filter for said inside days. The first five (5) lines of code or for checking for inside days. Anywho my....longwinded BACK door version of what you were asking for in your post. DID....not want ...er...to post it on YOUR forum ... SOOOOO started a new ONE. I think I will leave this one alone for a while. I like what Stockfetcher did with the code, will try to use it with some of my own stuff..... The code follows I think...... Three-Bar Net Line : at least as I am able to code it...... You ummm.....MIGHT find some of ....errr.... the code as FAMILIAR. You know what they say........... Imitation is the sincerest form of flattery Don't hate EMULATE!!!!!!! |
| tomriddle 2 posts msg #132462 - Ignore tomriddle |
11/11/2016 9:04:16 AM Hi all, I have been trying to find help to program this in SF: "After a stock hit a 250-day high, it shall not correct more than 25% from its high." I have been searching thru the forum and found this post. Can you help me to check if there is anything wrong with the following code: set{x1, Count(high at 250 day high,250) set{x2, Donchian Lower Band(x1,0)} set{x3, x2 / Donchian Upper Band(250,0)} x3 > 0.8 I tried to use VarOffset but cannot find a way to get it done. Any idea? |
| mahkoh 1,065 posts msg #132471 - Ignore mahkoh |
11/11/2016 2:52:40 PM Your first line misses a closing " } " |
| StockFetcher Forums · General Discussion · Question for Stockfetcher folks | << 1 2 >>Post Follow-up |