| StockFetcher Forums · General Discussion · RSI2 crossovers help, please | << >>Post Follow-up |
| Edial 6 posts msg #145630 - Ignore Edial |
12/19/2018 11:07:36 PM I am trying to see how many times in the last 100 days rsi(2) crosses below 5 (1 day ago) and then crosses above 5 next day [profit column] and how many times it stays below 5 [loss column]. All this for 100 days. I am getting numbers, but the sum of both columns for some of the stocks is above 100, which is impossible. What am I doing wrong? Thank you so much. Ed |
| Edial 6 posts msg #145651 - Ignore Edial |
12/21/2018 10:19:36 AM I see this is the wrong forum to post this ... |
| four 5,087 posts msg #145656 - Ignore four modified |
12/21/2018 12:41:21 PM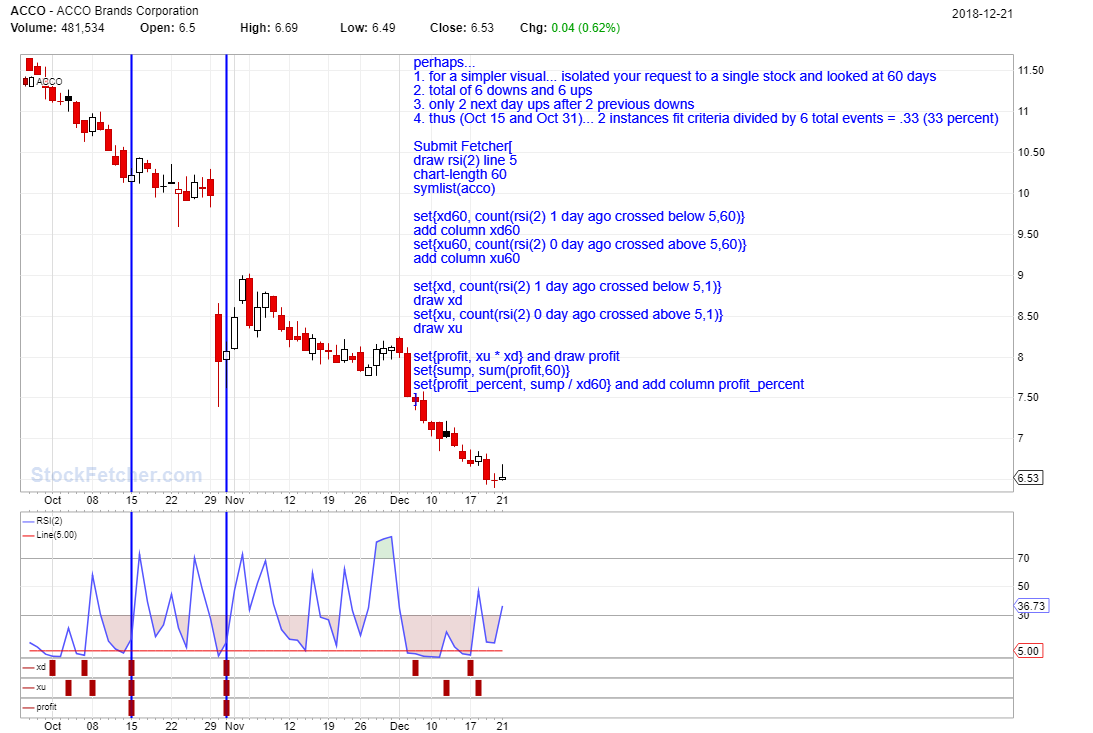 perhaps... 1. for a simpler visual... isolated your request to a single stock and looked at 60 days 2. total of 6 downs and 6 ups 3. only 2 next day ups after 2 previous downs (2 vertical lines on chart) 4. thus (Oct 15 and Oct 31)... 2 instances fit criteria divided by 6 total events = .33 (33 percent) |
| Edial 6 posts msg #145661 - Ignore Edial |
12/21/2018 3:30:41 PM Oh my goodness, thank you very much! :) So this (*) means 2 events together as one event. Thank you, now I can lower Rsi(2) and see what comes up. and thank you for the symlist idea ... now I can plug in anything to see the statistics. :) Ed |
| four 5,087 posts msg #145662 - Ignore four |
12/21/2018 3:47:06 PM very welcome |
| nibor100 1,103 posts msg #145663 - Ignore nibor100 |
12/21/2018 7:05:39 PM @Edial, The following are some tips regarding your 1st post in this thread: a. The asterisk * is the multiplication symbol in SF filter language, for use in set statements , as can be found in their manual/usage guide under Tools at the top right of their webpage; and as explained in these couple of posts from Support circa 2012: "At this time there is a limitation when using math operations inside of a function, you must use the explicit phrase for the function (plus, minus, divide, multiply.) Only direct operations in the "set{}" statements utilize the operation symbols (+,-,/,*). We agree that this limitation is rather odd; however, it is related to how the StockFetcher syntax is structured. The basic math operations were included in the basic StockFetcher syntax. These were designed to match the "plain-text" syntax of StockFetcher. Open this link: https://www.stockfetcher.com/images/support/usage-snip-2.png The symbol-based math operations were only added/designed with the more advanced "set{}" syntax, that was introduced later. Open this link: https://www.stockfetcher.com/images/support/usage-snip-1.png b. When my filters don't seem to do what I expect, I add an "Add Column" phrase for every variable name I used, for your initial filter I would have tried "add column" for dwn, up, and dwn1 and would have found that for some stocks multiplying dwn by dwn1 resulted in a number >100 just for your "Loss" variable. This is how I would do it in one line: "add column dwn and add column dwn1 and add column up" and for future filters you write if you ever need to check variable values in the pas,t I would use something similar to: "add column dwn 1 day ago and add column dwn1 1 day ago and add column up 1 day ago" etc. c. Normally questions asked in any of the Forum Discussion Groups will eventually be answered, but not always immediately, for a variety of reasons different for each user, in my case I thought the solution was kind of obvious so I was waiting a day to see if you solved it yourself which I find to be more rewarding... Ed S. |
| Edial 6 posts msg #145669 - Ignore Edial modified |
12/22/2018 10:19:30 AM Dear Ed S., thank you for your comments on the asterisk and the user guide, I was mainly learning by observing how other filters are setup by others. Also, your comment to use the add column more often, is very helpful. I had problems when I had some simple filters made and see it does not do what it suppose to do. Add column also makes it easier for me to 'see' and understand my own filter. Thanks, Ed |
| StockFetcher Forums · General Discussion · RSI2 crossovers help, please | << >>Post Follow-up |