StockFetcher Forums · General Discussion · SERIOUSLY ... Why Trade Individual Stocks ?<< >>Post Follow-up
alf44
2,025 posts
msg #117748
Ignore alf44
modified
1/15/2014 12:00:17 AM

.


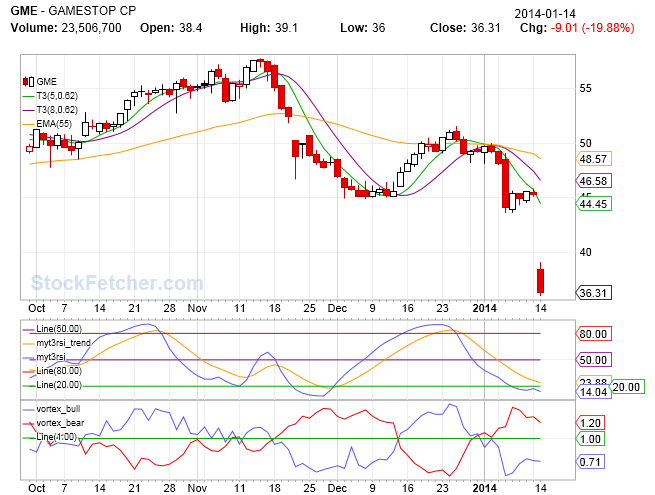
.


Do you REALLY wanna wake up to THIS ?

.

alf44
2,025 posts
msg #117749
Ignore alf44
modified
1/15/2014 12:22:40 AM

.

OH ... BTW !!!

Pay NO attention to the arcane chart indicators posted ...

... they might've just saved your sorry arse from this sorta BS !!!

.

stoxrox
10 posts
msg #118071
Ignore stoxrox
2/5/2014 5:52:36 PM

hey alf,
How do you set up a chart with those indicators? I could not find them. Thanks

miketranz
956 posts
msg #118072
Ignore miketranz
2/5/2014 8:10:28 PM

You'll be waking up to TWTR tomorrow....

Mactheriverrat
3,135 posts
msg #118074
Ignore Mactheriverrat
modified
2/5/2014 10:17:49 PM

IMHO
Never play earnings that report after market- The after hours and next day pre market trade will get theirs long before you can get yours. I know that I I got burned a few years ago by earnings that report after market. By the time my orders were filled I lost almost 40% of my investment on that one. For GME there was already some bad news before the big drop- Guess a few hedge funds and their buddies dumped all at the same time

From one of the new wires
Twitter was plunging 13.6% to $57 in afterhours trading even after its quarterly EPS and sales results blew past estimates, amid disappointing user growth numbers.

Like I said I Never play earnings that report after market-

On a side note GME looks like some good upside potential here.
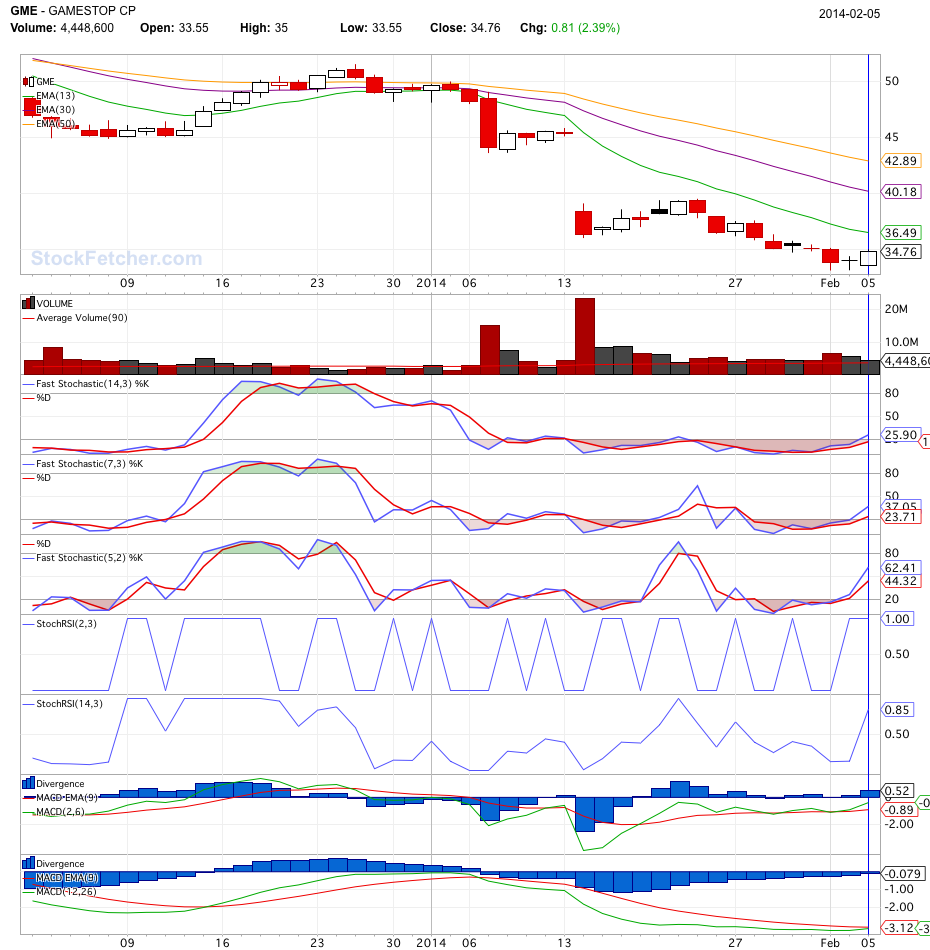


djones000buck
206 posts
msg #118095
Ignore djones000buck
2/6/2014 1:30:59 PM

Might need some tweeking/validation, what timeframe are you using in your indicator alf 14?

Fetcher[

/* Vortex Indicator */

/* Define some variables */
set{h0, high}
set{h1, high 1 day ago}
set{l0, low}
set{l1, low 1 day ago}
set{c0, close}
set{c1, close 1 day ago}

/* +VM calcs */
set{VMpos, h0-l1}
set{aVMpos, abs(VMpos)}
set{aVMpos14sum, sum(aVMpos,14)}

/* -VM calcs */
set{VMneg, l0 - h1}
set{aVMneg, abs(VMneg)}
set{aVMneg14sum, sum(aVMneg,14)}

/* True Range of var1 */
set{TRvar1, h0 - l0}

/* True Range of var2 */
set{TRvar2, h0 - c1}
/* Absolute value of TR var 2 */
set{aTRvar2, ABS(TRvar2)}

/* True Range of var3 */
set{TRvar3, l0 - c1}
/* Absolute value of TR var 3 */
set{aTRvar3, ABS(TRvar3)}

/*Find max of variables 1,2,3 */
set{max1, max(TRvar1, aTRvar2)}
set{TRmax, max(max1, aTRvar3)}

/* Sum 14 days of max True Range Values */
set{TRsum14, sum(TRmax,14)}

/*Calculate Vortex Indicator +VM */
set{plusVM, aVMpos14sum / TRsum14}

/*Calculate Vortex Indicator -VM */
set{minusVM, aVMneg14sum / TRsum14}

/* Add column displays */
add column plusVM
add column minusVM

/* Draw Indicator */
and draw plusVM
and draw minusVM on plot plusVM

/* add your filter criteria here */
average volume(90) > 1000000
price > 2

]


alf44
2,025 posts
msg #118098
Ignore alf44
2/6/2014 2:48:53 PM

.


.

Here is the syntax used to create the indicators ...


Fetcher[

/* Indicators */


/* Custom 8 period RSI of a Price Oscillator using Tillson Adaptive MAs */

set{myOSC1, T3(5,0.618) - T3(8,0.618)}
set{myT3RSI, CRSI(myOSC1, 8)}

set{myT3RSI_trend, CEMA(myT3RSI, 8)}


/* 8 period Vortex Trend Indicator */

set{plus_vm, abs(high minus low 1 day ago)}
set{minus_vm, abs(low minus high 1 day ago)}

set{plus_vm8, sum(plus_vm, 8)}
set{minus_vm8, sum(minus_vm, 8)}

set{atr1, average true range(1)}
set{tr8, sum(atr1, 8)}

set{vortex_bull, plus_vm8 / tr8}
set{vortex_bear, minus_vm8 / tr8}


/* ------------------------------ */


symlist(SPY,QQQ,DIA)


/* ------------------------------ */


/* Plots */

draw indicator T3(5,0.618)
draw indicator T3(8,0.618)
draw indicator EMA(55)

draw indicator myT3RSI
draw indicator myT3RSI line at 80
draw indicator myT3RSI line at 20
draw indicator myT3RSI line at 50
draw indicator myT3RSI_trend on plot myT3RSI

draw indicator vortex_bull
draw indicator vortex_bear on plot vortex_bull
draw indicator vortex_bull line at 1.00

chart-time is 4 Months

chart-scale is logarithmic
]


.

alf44
2,025 posts
msg #118101
Ignore alf44
modified
2/6/2014 4:32:14 PM

.


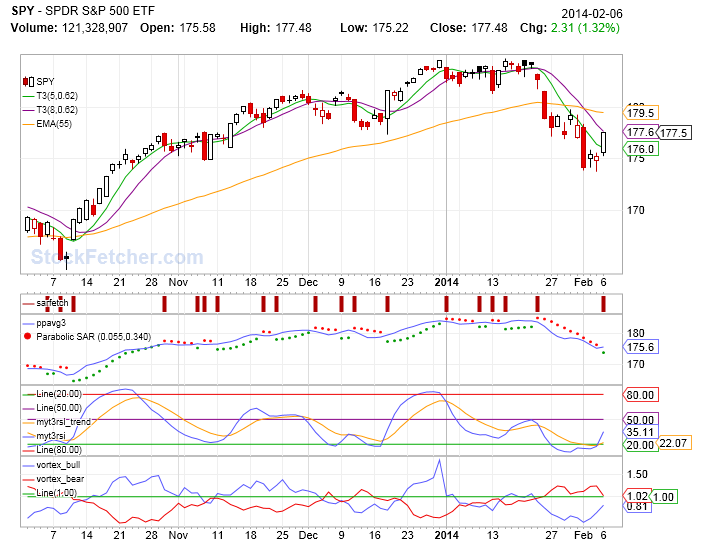
.

FWIW ... here it is ... with my "Red Light ... Green Light" indicator added ...


Fetcher[

/* Indicators */

/* LONG SAR */

set{SAR1, count(Parabolic SAR(0.055,0.34) below PP, 1)}
set{SAR2, count(Parabolic SAR(0.055,0.34) 1 day ago above PP 1 day ago, 1)}

set{SAR3, SAR1 * SAR2}

/* ---------*/

/* SHORT SAR */

set{SAR11, count(Parabolic SAR(0.055,0.34) above PP, 1)}
set{SAR22, count(Parabolic SAR(0.055,0.34) 1 day ago below PP 1 day ago, 1)}

set{SAR33, SAR11 * SAR22}

/* --------- */

/* SAR Fetch */

set{SARfetch, SAR3 + SAR33}


/* Pivot Point 3 day average Lower Plot */

set{PPsum3, sum(PP, 3)}
set{PPavg3, PPsum3 / 3}

/* ---------- */

/* Custom 8 period RSI of a Price Oscillator using Tillson Adaptive MAs */

set{myOSC1, T3(5,0.618) - T3(8,0.618)}
set{myT3RSI, CRSI(myOSC1, 8)}

set{myT3RSI_trend, CEMA(myT3RSI, 8)}

/* ----------*/

/* 8 period Vortex Trend Indicator */

set{plus_vm, abs(high minus low 1 day ago)}
set{minus_vm, abs(low minus high 1 day ago)}

set{plus_vm8, sum(plus_vm, 8)}
set{minus_vm8, sum(minus_vm, 8)}

set{atr1, average true range(1)}
set{tr8, sum(atr1, 8)}

set{vortex_bull, plus_vm8 / tr8}
set{vortex_bear, minus_vm8 / tr8}

/* ------------------------------ */

symlist(SPY,QQQ,DIA)

/* ------------------------------ */

/* Plots */

draw SARfetch

draw indicator T3(5,0.618)
draw indicator T3(8,0.618)
draw indicator EMA(55)

draw indicator PPavg3
draw indicator Parabolic SAR(0.055,0.34) on plot PPavg3

draw indicator myT3RSI
draw indicator myT3RSI line at 80
draw indicator myT3RSI line at 20
draw indicator myT3RSI line at 50
draw indicator myT3RSI_trend on plot myT3RSI

draw indicator vortex_bull
draw indicator vortex_bear on plot vortex_bull
draw indicator vortex_bull line at 1.00

chart-time is 4 Months

chart-scale is logarithmic
]


.

StockFetcher Forums · General Discussion · SERIOUSLY ... Why Trade Individual Stocks ?<< >>Post Follow-up

*** Disclaimer *** StockFetcher.com does not endorse or suggest any of the securities which are returned in any of the searches or filters. They are provided purely for informational and research purposes. StockFetcher.com does not recommend particular securities. StockFetcher.com, Vestyl Software, L.L.C. and involved content providers shall not be liable for any errors or delays in the content, or for any actions taken based on the content.


Copyright 2022 - Vestyl Software L.L.C.Terms of Service | License | Questions or comments? Contact Us
EOD Data sources: DDFPlus & CSI Data Quotes delayed during active market hours. Delay times are at least 15 mins for NASDAQ, 20 mins for NYSE and Amex. Delayed intraday data provided by DDFPlus


This site is protected by reCAPTCHA and the Google Privacy Policy and Terms of Service apply.