| StockFetcher Forums · General Discussion · SF ... Parabolic SAR color plot ... | << 1 2 >>Post Follow-up |
| alf44 2,025 posts msg #117250 - Ignore alf44 modified |
12/5/2013 11:11:13 PM . Bottom Line ... the NEW feature looks GREAT ! "My" problem was related to a CEMA / CMA issue WRT the Accumulation Swing Index (ASI) ... NOT ... the NEW SAR feature ! ----- TYVM ... StockFetcher !!! . |
| alf44 2,025 posts msg #117253 - Ignore alf44 modified |
12/6/2013 12:13:02 AM . ... the Red & Green sorta reminds me of Christmas ... uhhh ... MERRY CHRISTMAS !!! ----- WHAT A HUGE IMPROVEMENT !!! IMO . |
| alf44 2,025 posts msg #117393 - Ignore alf44 modified |
12/17/2013 6:33:49 PM . SF Guys ... if you're watching / listening ... ... is there a way I can somehow plot the Parabolic SAR ... it's changes from GREEN to RED to GREEN etc ... in a window (straight line across) BELOW it's daily corresponding price plot ... Like this: ............................................. ... rather than (or, in addition to) an overlay ON the price plot ? Perhaps it's "corresponding" daily value could be shown to the right as the cursor was moved across the price plot ! ----- Maybe, by defining it somehow with set statements ... and having it display each day (as shown above) ??? Anything ??? I am at your mercy ... Oh Great and Powerful OZ !!! Possible ??? TIA . |
| alf44 2,025 posts msg #117398 - Ignore alf44 modified |
12/18/2013 1:35:12 AM . I GET how to scan for / display turns in SAR ... --- 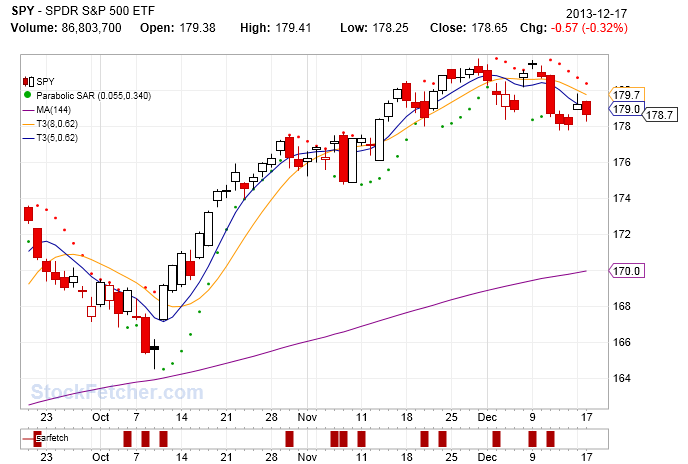 --- I would like to take this UP a notch ... as described in the previous post !!! TIA . |
| Mactheriverrat 3,178 posts msg #117401 - Ignore Mactheriverrat |
12/18/2013 10:13:17 AM THANKS alf44 That is some great code work! |
| alf44 2,025 posts msg #117407 - Ignore alf44 |
12/18/2013 2:46:29 PM . ... appreciate that, Mac ! . |
| alf44 2,025 posts msg #117409 - Ignore alf44 modified |
12/18/2013 2:51:44 PM . I was giddy with anticipation this morning when I woke up ... hoping to find the shiny new SAR display under my Christmas tree ... ... but, alas ... it was not to be ! 
. |
| marine2 963 posts msg #117411 - Ignore marine2 |
12/18/2013 3:11:37 PM With the Parabolic Sars graphics being shown on a specific stock chart via your coding is there a way of eliminating the daily candle pricing this chart is also showing. It seems to muddy up the graphics when both the Parabolic Sars dot imaging clashes with the candle pricing images. Too much clutter. I would rather see just the Parabolic Sars imaging alone. See what you can do about that. If not you then maybe StockFetcher staff can make this work. Thank you. |
| marine2 963 posts msg #117412 - Ignore marine2 |
12/18/2013 3:22:43 PM Also, when going into the "historical" (example, the 3 mo,6 mo, 1 year, 2 year, HISTORICAL modes you can chart for) graph chart associated with charts derived from a particular filter you do not see the difference in Parabolic Sars colors (red and green) like you're supposed to, instead you see one color? |
| marine2 963 posts msg #117413 - Ignore marine2 |
12/18/2013 3:29:31 PM Just wondering what StockFetcher staff is doing to fix this charting to make it user friendly and easy on the eyes. Meaning, maybe they could provide vertical color band through the graphing portions, green = buy periods, and red = sell periods? There the Parabolic graphics could be hidden or put down in the lower sections of the graph chart to isolate it away from the pricing graphics on the chart itself. Just saying, where there's a will, there's a way..... |
| StockFetcher Forums · General Discussion · SF ... Parabolic SAR color plot ... | << 1 2 >>Post Follow-up |