| StockFetcher Forums · General Discussion · SF ... please explain this ... | << >>Post Follow-up |
| alf44 2,025 posts msg #117154 - Ignore alf44 modified |
12/2/2013 2:29:18 PM . Below is a small part of numerous scans that I use. The purpose is to show in a column ... "how many days the MA(10) has been either ABOVE or BELOW the EMA(30)" ! Lately, I've started to notice that every now and then certain symbols appear where this number is just incorrect ... PCLN being one ! --- Run this ... observe the column info and you will see -1 appear for both PCLN and MA (MA being MasterCard) ... That would seem to indicate that the MA(10) has just crossed BELOW the EMA(30) in the last day ... NOW ...pull up the chart ... observe the position of the two MAs (MAs being Moving Averages) ... Clearly not accurate !!! NOW start clicking backward ... a day, a week, a month ... observe column and chart ... the -1 never changes in the column info and the MAs on the chart clearly show the error ! ----- ----- Thoughts ? . |
| stockfetcher 980 posts msg #117155 |
12/2/2013 2:42:40 PM Hi, If the condition in the DAYS function is not matched then the days function will return -1. In your example the the ma(10) is not below ema(30) within the 100 day period (even offsetting by a month). If you run the following example: Then step back 3 months you should see the variables start to show up. 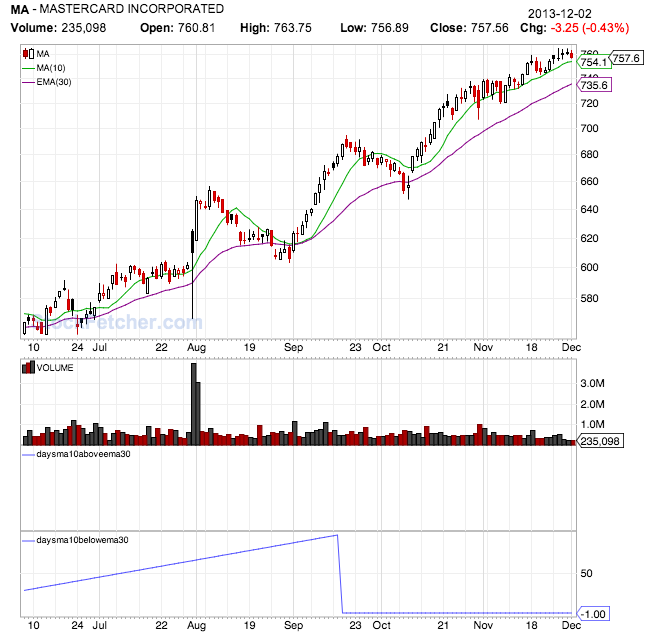 And with a 3 month date offfset: 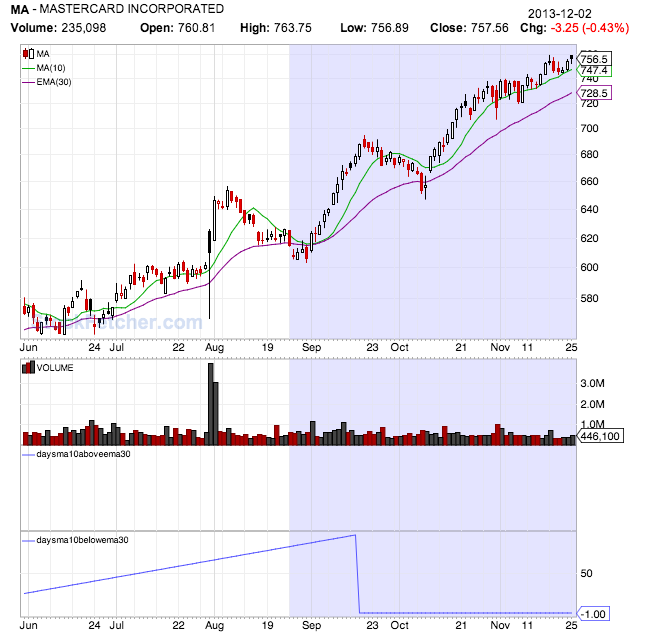 Regards, StockFetcher.com |
| alf44 2,025 posts msg #117156 - Ignore alf44 |
12/2/2013 2:52:50 PM . ... so it is an issue with the maximum 100 day lookback limitation ... correct ? I kinda suspected that must be it ! . |
| stockfetcher 980 posts msg #117157 |
12/2/2013 2:56:15 PM Hi, Yes, that is correct. Given the maximum for DAYS is only 100, the look back period ends before the condition you are looking for is met. And before Kevin chimes in, yes we are still evaluating what it would take to increase some of the limitations as well as fully document the periods on various indicators. :) Thanks, StockFetcher |
| alf44 2,025 posts msg #117158 - Ignore alf44 modified |
12/2/2013 3:00:11 PM . ... so that column info for PCLN, MA (for example) will continue to read -1 "until" the 10 crosses BELOW the 30 ! Which seemingly ... will never again happen ! LOL . |
| StockFetcher Forums · General Discussion · SF ... please explain this ... | << >>Post Follow-up |