| StockFetcher Forums · General Discussion · ^SPX or SPY Comparison Crossover | << 1 2 >>Post Follow-up |
| nibor100 1,103 posts msg #159197 - Ignore nibor100 |
6/11/2022 1:44:34 AM @snappyfrog, Unfortunately, the crossovers you see on your early charts for ^SPX are not real as SF dropped using it as the index symbol for the SP500 in late 2020, the new symbol is ^INX. Because of the way SF charts retain historical data they continue to draw the ^SPX chart lines which are correct prior to end of Dec 2020 but from that point on they are just a straight meaningless horizontal line with a value of -100. The 2 short filters below when compared after they are expanded to the 2yr view will show that fairly clearly. Ed S. |
| snappyfrog 753 posts msg #159198 - Ignore snappyfrog |
6/11/2022 10:45:53 AM Thanks, I learn something new every day! |
| styliten 350 posts msg #159199 - Ignore styliten |
6/11/2022 12:07:20 PM @ snappyfrog Would this work? set{a1, close divided by ind(spy, close)} show stocks where count(a1 crossed above cema(a1, 15), 3) > 0.5 cf. |
| Mactheriverrat 3,178 posts msg #159201 - Ignore Mactheriverrat |
6/11/2022 4:04:36 PM DRV with future resistance lines 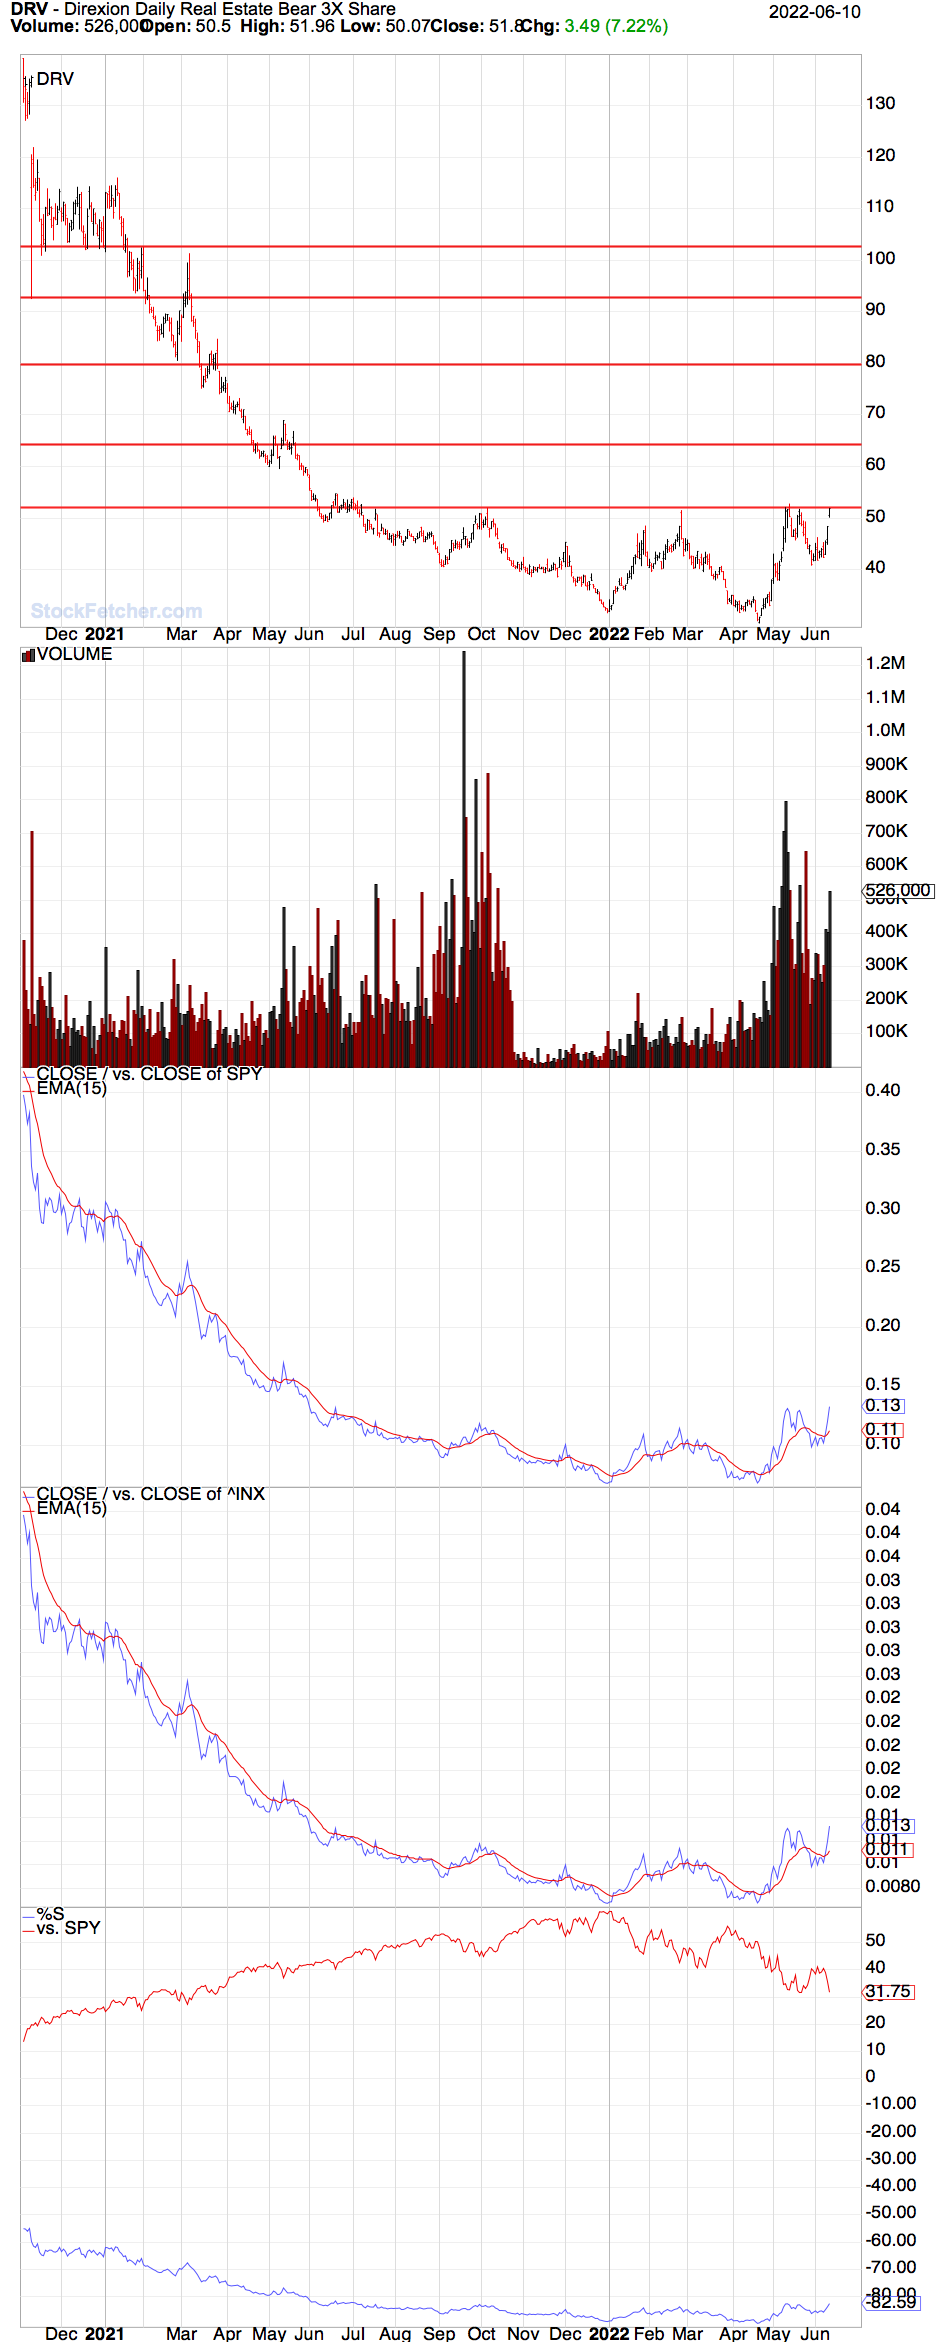 |
| snappyfrog 753 posts msg #159202 - Ignore snappyfrog |
6/11/2022 9:44:30 PM Thanks styliten, Some charts look close, but others such as this one wouldn't work well.  |
| snappyfrog 753 posts msg #159203 - Ignore snappyfrog |
6/11/2022 10:02:40 PM I believe this is the problem - compare starts the chart with both lines even. Here is a 3 month and 6 month chart of AMD. Both charts start the lines together, but you can see the difference by the end of the charts. "The new comparison plot will compare the change in price from the initial day of your chart." 
 |
| styliten 350 posts msg #159204 - Ignore styliten |
6/12/2022 12:30:47 AM @ snappyfrog Personally, I tried to stay away from subplots as much as possible. Hopefully this would be the equivalent result you were looking for: If you want to see the smoothed price line on the price plot, replace "draw cema(a3, 15) on plot price" with "draw cema(clri(a3, 9), 15) on plot price". And if you want shorter comparison time frame, use 20 days instead: |
| snappyfrog 753 posts msg #159205 - Ignore snappyfrog |
6/12/2022 10:36:03 AM Thanks for all of the help. I am not finding what I want, so I guess I'll find another rabbit hole to go down lol. |
| nibor100 1,103 posts msg #159208 - Ignore nibor100 |
6/12/2022 3:55:51 PM @snappyfrog, 1. With the info you posted about the SF "compare" feature, i decide to look at the VectorVest Performance graph option, for both your original posted chart on WTI (which had 2 good looking crossovers) and your 2 AMD charts and the VV performance charts for the identical timeframes were almost mirror images of those SF compare charts. The VV performance charts are just computed %change of any stock or industry from a common date starting point so actually very easy to compute, unfortunately as we can all see in your 2 AMD charts, crossover are very dependent on the starting date chosen for the comparisons, so probably not too useful for making buy or sell decisions. The comparison of a stocks relative strength to that of the Spy/^INX is probably a more useful tool and is a key part of the Stan Weinstein methodology. 2. I don't know if the "KING" has been following this thread, but another thing that could be fixed by new SF staff would be the fact that these 'Compare" subgraphs when viewed in chart mode of filter results are not the same subgraphs shown when opening the same charts in full chart window mode (very odd...) Ed S. |
| snappyfrog 753 posts msg #159209 - Ignore snappyfrog |
6/12/2022 9:24:30 PM Thanks again nibor, I agree that relative strength looks to be more usable. It was worth a try though. |
| StockFetcher Forums · General Discussion · ^SPX or SPY Comparison Crossover | << 1 2 >>Post Follow-up |